4.28 PSSA Review: Life, Earth and Space
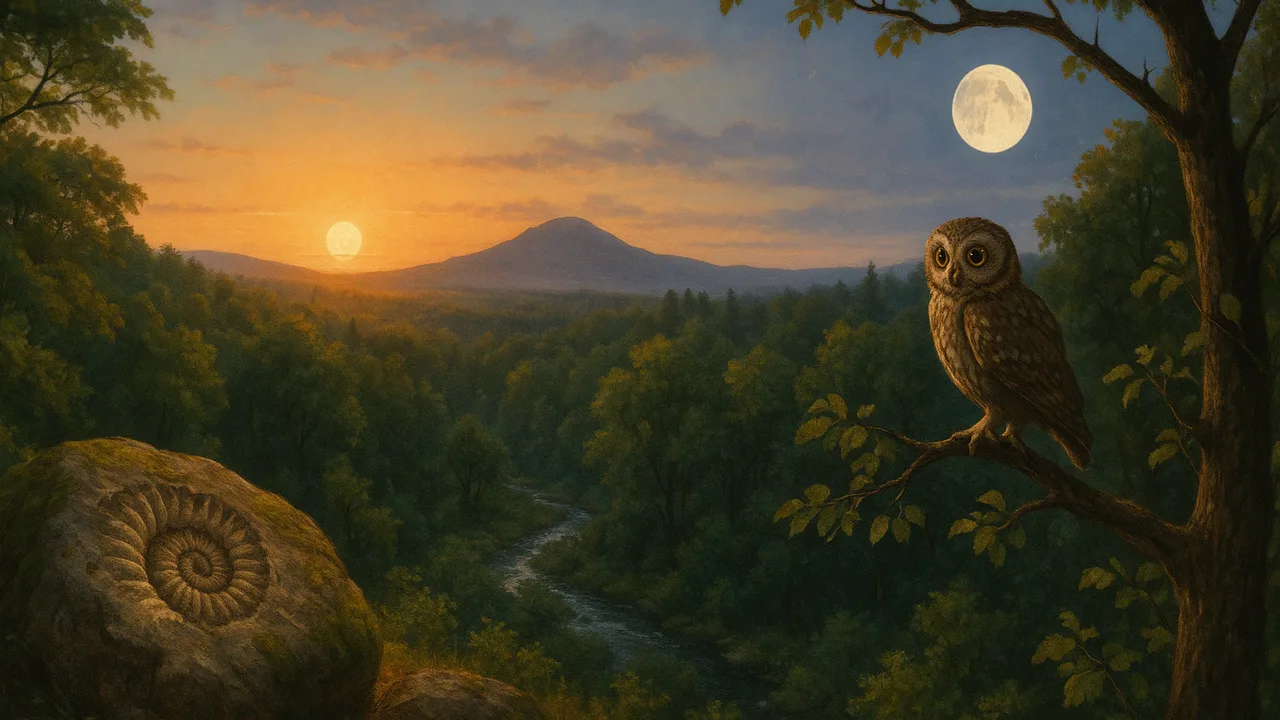
review grades 6–8 life, Earth and space science with PSSA-style items and connect them to biodiversity and climate data.
- I can identify and describe data about the types and numbers of species in an ecosystem.
- I can explain what factors can affect how stable the biodiversity is in an ecosystem.
- I can describe ecosystem services, like water purification or soil erosion prevention, and how they help keep the ecosystem stable.
- I can ask questions about patterns in data that connect natural processes and human activities to changes in global temperatures over the past century.
- I can ask questions about patterns in data that connect changes in human activities or natural processes related to greenhouse gas production to changes in the amounts of carbon dioxide and other greenhouse gases in the atmosphere.
- I can explain how a human activity causes negative effects on the environment using scientific principles.
- I can tell the difference between a cause-and-effect relationship and a correlation when I design a solution to an environmental problem.
Phase 5: Prove It
Warm-Up ~5 min
Do Now. Draw a quick sketch that connects the Sun, a plant, a rabbit and a hawk. Add arrows for energy and label one place where matter is recycled.
Plants get most of the matter to build their bodies from carbon dioxide in the air and water, using light energy.
Instruction ~10 min
PSSA review, part 2. Today: life, Earth and space science from grades 6–8, in four stations, with PSSA-style items.
Station 1: cells and body systems. Remember from grade 7: all living things are made of one or more cells. Cells form tissues, tissues form organs, and organs work together in body systems, such as the respiratory and circulatory systems delivering oxygen.
Station 2: ecosystems. Plants use light energy to make sugar from carbon dioxide and water. Energy flows through a food web and is lost as heat at each step; matter cycles, with decomposers returning nutrients to soil. This year you learned that more biodiversity usually helps an ecosystem stay stable.
Station 3: Earth systems and weather. Remember from grade 6: matching fossils and rocks on different continents, the shapes of continents and seafloor features are evidence that plates move. Weather changes when air masses meet, as at a cold front.
Station 4: space. The Moon is always half lit by the Sun; its phases are how much of that lit half we see. Seasons happen because Earth’s axis is tilted, not because Earth gets closer to the Sun.
Worked example 1: a food-web data item. Sample data. A pond survey finds 40 frogs one year and 10 the next, while insects increase. Mei reasons: “Fewer frogs eat fewer insects, so insects rise. To explain the frog drop, I’d check water quality and habitat data.”
Worked example 2: asking a question about climate data. Looking at a graph of spring arrival dates for a migrating bird alongside local average temperature, Hana asks: “As average spring temperature rose over the past 50 years, did the birds arrive earlier, and by how many days?” She names the data, the pattern and a possible link.
Guided Exercises ~15 min
Station items. Answer on your own, then check with a partner.
Independent Practice ~10 min
Short constructed responses, scored 0–2.
(2 points) Sample data: a wetland survey found 8 frog species in 1990 and 3 today. Describe what this data shows about biodiversity, and name one factor that could have affected it.
(2 points) Write two questions you could ask about a graph of global average temperature since 1900: one about a pattern and one about a possible cause.
Closure ~5 min
You have reviewed grades 6–8 science, scientists. You are ready to show what you know on the PSSA.
Exit ticket: write the one idea from this unit or the review you are most confident about, and the one you will review tonight.
How confident are you that you can I can answer PSSA-style questions about life, Earth and space science.
Teacher notes
Materials: four station signs and item cards, an onion slide and microscope if available, a lamp and ball for a Moon-phase demo, a world map with fossil locations.
Setup: run as a choice board with a common starting station for students who scored lowest on 4.26. Grade 6–7 codes are tagged in the footer; the Unit 4 items give a light review of MS-LS2-5, MS-ESS3-5 and MS-ESS3-3. All survey numbers are sample data.
Listen for: “plants eat soil”; “summer is when Earth is closest to the Sun”; “the Moon’s phases are Earth’s shadow” (that is an eclipse).
Scoring (0–2): frogs: 2 = describes the drop in species and names a plausible factor (habitat loss, runoff, disease); 1 = one part. Questions: 2 = both testable and tied to the graph; 1 = one.
Support / stretch: picture cards for each station. Stretch: write a scenario set of three linked items for a classmate.