4.04 The School Audit: Measuring Our Water and Energy
measure water and energy use at school stations and explain how per-person use adds up to a large demand on natural resources.
- I can explain, using reasoning, how increases in human population or per-person resource use lead to more natural resource consumption.
- I can explain how using more natural resources causes changes in Earth’s systems.
- I can describe how human population growth affects natural resource use, which then causes changes in Earth’s systems.
- I can use scientific information to design a solution that addresses the effects of a specific human activity on the environment.
- I can include technologies in my design that help monitor and reduce the negative impacts of human activities on the environment.
Phase 2: Investigate
Warm-Up ~5 min
Do Now. Guess how many liters of water flow from one classroom sink faucet in one minute. Write your guess and a reason.
Which school station do you predict uses the most water in a normal day?
Instruction ~10 min
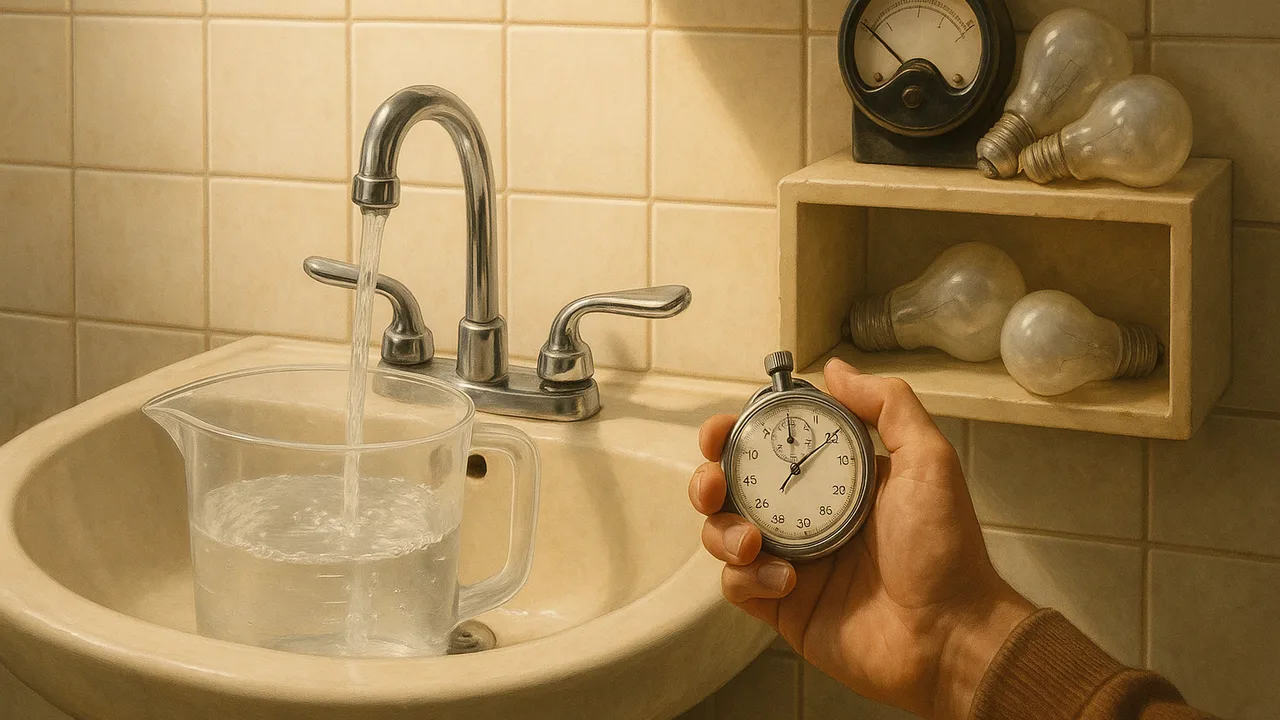
Explore first. Your team rotates through stations with a measuring cup, a timer and a clipboard. Measure, then multiply by how often each thing is used. All results are your class’s sample data.
| Station | What we measured | Amount per use or per hour | Uses or hours per day (estimate) | Daily total |
|---|---|---|---|---|
| Classroom sink | mL in 10 s of flow | |||
| Drinking fountain | mL in 10 s of flow | |||
| Classroom lights | watts on bulb labels × number of bulbs | |||
| Plug loads | watts on device labels (screens, chargers) | |||
| Waste bin | kg of trash in one class bin |
Name the ideas. An audit is a careful count of what a place uses. A flow rate is how much water passes in a set time. Power, in watts, tells how fast a device uses energy. Small amounts per person or per device add up when you multiply by many people and many days.
Worked example 1: scaling a faucet. Sample data: Malik collected 1,000 mL in 10 seconds, so 6,000 mL, or 6 L, flow per minute. If the sink runs 20 minutes a day in total, that is 6 × 20 = 120 L a day. Over 180 school days, 120 × 180 = 21,600 L a year from one sink.
Worked example 2: lights left on. Sample data: a room has 10 bulbs of 15 watts each, or 150 watts. Left on for 2 extra hours a day, that is 150 × 2 = 300 watt-hours a day. Thirty rooms doing the same use 9,000 watt-hours, or 9 kilowatt-hours, every day. Generating that electricity often means burning fuel at a power plant.
From audit to monitor. A monitor is an audit repeated on a schedule. Simple tools such as a timer, a measuring cup, a bathroom scale or a plug-in energy meter are monitoring technologies.
Guided Exercises ~15 min
Use your audit data. Show your math for each card.
Independent Practice ~10 min
Turn your team’s numbers into a claim.
Scale your biggest daily total to a full school year of 180 days. Explain how this connects per-person use to a larger demand on water or energy resources.
Which station would be easiest to measure every week in under 10 minutes? Name the tool you would use.
Closure ~5 min
Our numbers are a baseline. Next time, we test what happens to rain that falls on our pavement and our grass.
Exit ticket: explain how a growing school population or higher per-student use leads to more natural resource use. Use one number from your audit.
Teacher notes
Materials (per team): 1 L measuring cup, stopwatch or phone timer, clipboard, calculator, bathroom scale for one trash bin (optional), flashlight for reading device labels. Optional: one plug-in energy meter for the class.
Setup: arrange access with the custodian or facilities lead beforehand; they often know daily use patterns. Restroom totals come from an adult reading the building water meter or posted data, not students timing toilets. Keep stations on one hallway if time is short.
Listen for: confusing watts (a rate) with watt-hours (an amount). Use the analogy of speed versus distance. Keep every school number labeled sample data; they are estimates.
Support / stretch: give a multiplication frame: ___ per use × ___ uses = ___. Stretch: estimate how much the yearly total would change if every sink ran 25% less time.