3.11 Family Resemblances: Modeling Relatedness
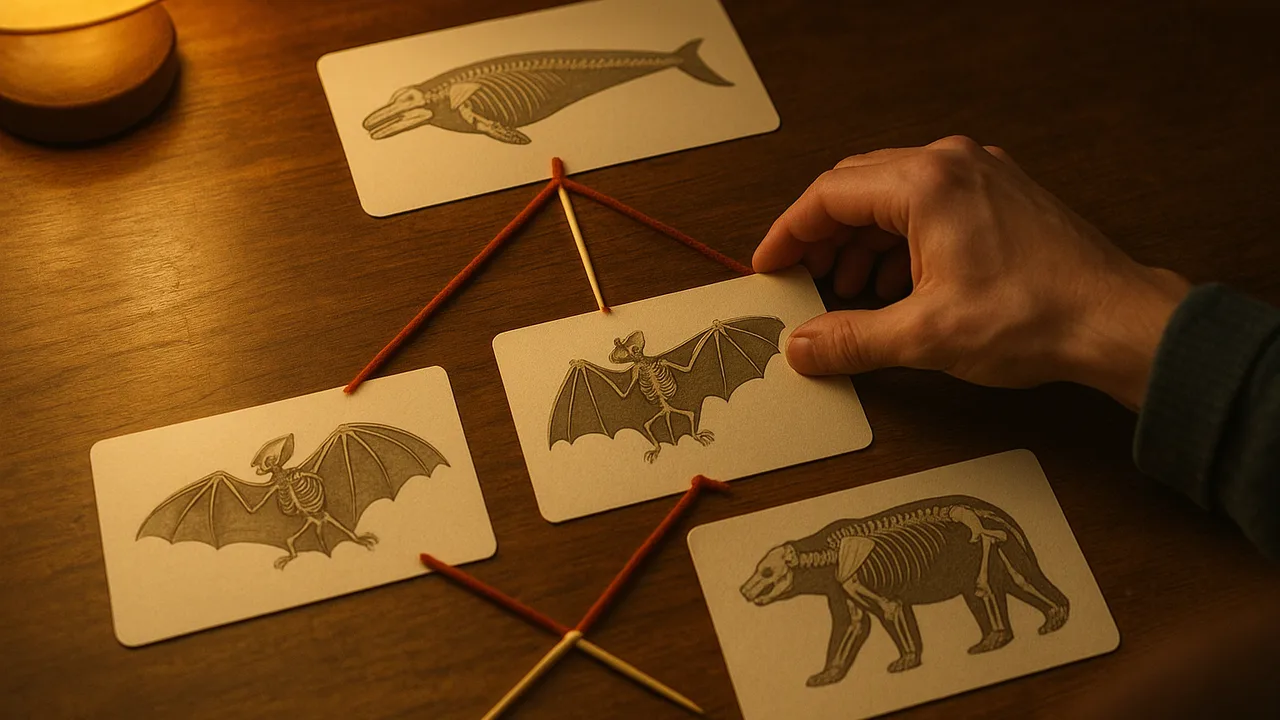
build a branching model that uses anatomy, fossils and embryos to explain how organisms are related.
- I can use reasoning to show that organisms with similar anatomical features are likely to be more closely related because of their genetic makeup.
- I can explain how changes in anatomical features seen in fossils can help scientists trace evolutionary relationships between extinct and living organisms.
- I can use patterns in embryo development to explain how different species are related, even if they look very different as adults.
Phase 3: Make Sense
Warm-Up ~5 min
Do Now. Think about a family photo or a group of cousins. Which features show people are related? Do relatives always look identical? Write two sentences.
A bat, a bird and a fish: which two do you predict are most closely related?
Instruction ~10 min
Reading: three lines of evidence. Adult anatomy shows shared bone plans hiding under different shapes. Fossils show those plans changing across layers. Embryos show shared early development even when adults look very different. Shared features are inherited, passed down in the genetic information of each generation. So the more features two species share, the more recent their common ancestor is likely to be.
Building a branching model. A branching diagram is a model of relatedness. Each split stands for a common ancestor. Species that split apart more recently share more features.
| Feature | Fish | Bird | Bat | Cat | Human |
|---|---|---|---|---|---|
| Backbone | |||||
| Tail and throat folds as early embryo | |||||
| One upper bone, two lower bones in forelimb | |||||
| Hair or fur | |||||
| Feathers | |||||
| Feeds young with milk |
Worked example 1: counting shared features. Ava filled the table. Every organism has a backbone and the early-embryo features. The fish lacks the forelimb bone plan. Only the bat, cat and human have hair and feed young with milk. So she drew the fish branch splitting off first, then the bird, then the mammals together.
Worked example 2: placing a fossil. Jamal added the feathered dinosaur from 3.05. It has the forelimb plan and feathers, but no hair. He placed it on the bird branch, close to where birds split from other reptiles. A fossil can sit on a branch that leads to living species, or on a side branch that ended in extinction.
Limits of the model. Our diagram uses only six features and a few species. Scientists use many more traits and genetic evidence, and they revise diagrams when new evidence appears.
Guided Exercises ~15 min
Use your completed feature table and branching diagram.
Independent Practice ~10 min
Explain your model.
Write an explanation of why a cat and a human are more closely related than a cat and a fish. Use at least one anatomy feature and one embryo feature.
Name one limitation of your branching diagram and what new evidence could improve it.
Closure ~5 min
Our model ties the evidence together. Next time, we model the visitor’s side of the exhibit: how senses become actions and memories.
Exit ticket: describe the pattern in embryo development and explain how it supports the idea that very different adults can share a common ancestor.
Teacher notes
Materials: feature tables, chart paper for branching diagrams, the card sets from 3.04–3.06.
Setup: teams fill the table, then draw the diagram. Compare diagrams; disagreements become discussions about evidence.
Listen for: reading the diagram as a ladder with humans at the top, and “humans came from cats.” No living species is the ancestor of another living species; they share ancestors. Keep genetics general: no molecular detail.
Support / stretch: give a partly drawn diagram with the fish branch placed. Stretch: add a frog and a whale and justify where each goes.