3.08 When the Wetland Changed: Population Data
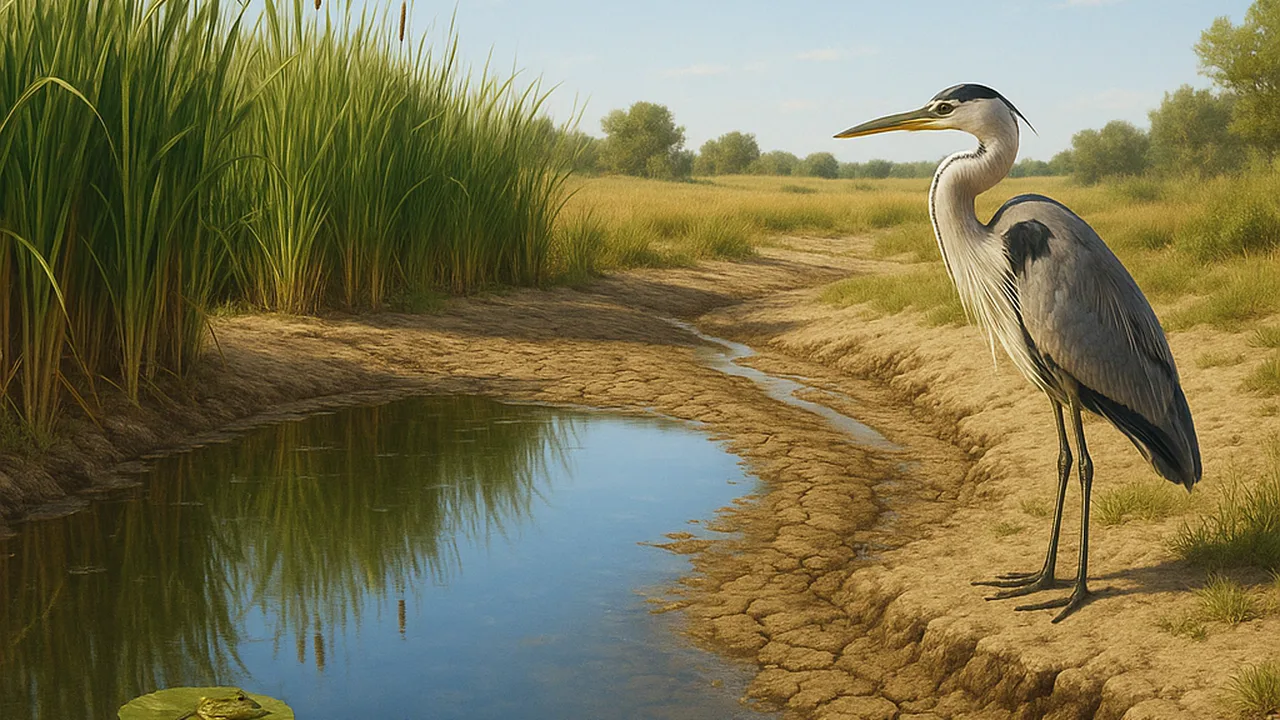
graph and analyze sample ecosystem data to describe how a drought and a new predator changed the populations of a wetland.
- I can describe evidence about changes in the physical or biological parts of an ecosystem, including how big those changes are.
- I can describe evidence about changes in populations, including how big those changes are and what types of species are present.
- I can identify evidence that shows whether changes in ecosystem parts are related to changes in populations, including both cause-and-effect and patterns.
- I can make a claim that changes to physical or biological parts of an ecosystem can affect the populations living there.
Phase 2: Investigate
Warm-Up ~5 min
Do Now. Remember from grade 6: an ecosystem has living parts, such as plants and animals, and nonliving parts, such as water, sunlight and soil. List three living and three nonliving parts of a wetland.
A wetland has two dry summers in a row. What will happen to the number of frogs?
Instruction ~10 min
Explore first: data set A, a drought. These are sample data from a made-up wetland survey. Graph frogs and herons against year on one line graph, with water cover on a second axis or a second graph.
| Year | Summer rainfall (sample, cm) | Wetland covered by water (sample, %) | Adult frogs counted (sample) | Dragonfly larvae per net sweep (sample) | Heron sightings (sample) |
|---|---|---|---|---|---|
| 1 | 30 | 80 | 220 | 12 | 9 |
| 2 | 28 | 78 | 230 | 11 | 10 |
| 3 | 12 | 45 | 150 | 6 | 7 |
| 4 | 10 | 35 | 80 | 4 | 4 |
| 5 | 27 | 70 | 110 | 9 | 5 |
| 6 | 31 | 82 | 170 | 11 | 7 |
Data set B, a new predator. Sample data. In year 2, a predatory fish that eats tadpoles was released into one pond. A nearby pond had no new fish. Record the pattern in your own table.
| Year | Pond with new fish: tadpoles per sweep (sample) | Pond without new fish: tadpoles per sweep (sample) | Difference | What I notice |
|---|---|---|---|---|
| 1 | 40 | 38 | ||
| 2 | 31 | 41 | ||
| 3 | 14 | 39 | ||
| 4 | 6 | 42 |
Name the ideas. A population is all the members of one species in an area. Changes to the physical (nonliving) parts of an ecosystem, like water, or the biological (living) parts, like a new predator, can change populations. Describe a change by its direction and its size. A pattern that goes together is a correlation; showing cause and effect needs more, such as a comparison pond.
Worked example 1: size of a change. In data set A, water cover fell from 78% to 35% between years 2 and 4. Adult frogs fell from 230 to 80, a drop of 150, or about two thirds. Herons fell too, from 10 to 4. Both prey and predator shifted with the water.
Worked example 2: using a comparison. In data set B, both ponds started near 40 tadpoles per sweep. Only the pond with the new fish fell, to 6. Because the other pond stayed steady, the comparison makes the fish a much stronger explanation than weather, which both ponds shared.
Multiple sources. Scientists back up counts with other evidence, such as water-gauge readings and aerial photos of the wetland’s edge. Evidence that agrees from several sources makes a claim stronger.
Guided Exercises ~15 min
Use your graphs from data sets A and B.
Independent Practice ~10 min
Start an argument from the data.
Write a claim about how the drought affected two populations. Support it with numbers from data set A, including the size of each change.
Name one more source of evidence that would make your claim stronger and explain what it would show.
Closure ~5 min
Living communities shift when their world changes, and the fossil record shows that has happened throughout Earth’s history. Next time, we define exactly what our exhibit must do.
Exit ticket: describe one change to a physical part and one change to a biological part of the wetland, and the population change that followed each, with numbers.
Teacher notes
Materials: graph paper or a spreadsheet, colored pencils, the two sample data sets. All numbers are invented teaching data; say so.
Setup: pairs graph set A while the other pair in the team graphs set B, then they teach each other.
Listen for: “the frogs moved away so it doesn’t count” (it is still a population change in this area) and treating any correlation as proof. Students who have lived through floods, droughts or wildfires may find this topic personal; keep the focus on the wetland.
Support / stretch: provide pre-labeled axes. Stretch: predict what would happen to the algae that tadpoles eat in the pond with the new fish, and explain the chain.