4.12 Modeling Our Watershed: How Small Changes Ripple
use a watershed model to compare how design solutions maintain biodiversity and ecosystem services, including side effects elsewhere in the ecosystem.
- I can use scientific evidence to compare how well each design solution maintains ecosystem stability and biodiversity.
- I can explain the strengths and weaknesses of each design solution based on different criteria and constraints, such as scientific, social, and economic factors.
- I can assess possible side effects that each design solution might have on other parts of the ecosystem, including how a small change in one part could lead to big changes elsewhere.
- I can identify and describe data about the types and numbers of species in an ecosystem.
- I can explain what factors can affect how stable the biodiversity is in an ecosystem.
- I can describe ecosystem services, like water purification or soil erosion prevention, and how they help keep the ecosystem stable.
Phase 3: Make Sense
Warm-Up ~5 min
Do Now. A watershed is all the land that drains to the same stream or wetland. Sketch our school, the slope, the storm drain and the wetland in one simple drawing.
Mowing grass right to the creek edge removes the buffer. What is the most likely ripple effect?
Instruction ~10 min
Reading: a watershed is a system. Water flows downhill from rooftops, lots and lawns into storm drains, ditches and finally the wetland. Along the way, soil, roots and wetland plants filter it. Insects, frogs, birds and fish depend on clean, steady water. Each species is linked to others in a food web. If runoff brings mud, sunlight cannot reach underwater plants. If those plants die, insects that eat them decline, and so do the frogs that eat the insects. A small change in one part can lead to big changes elsewhere. Design solutions aim to restore the services that keep this system stable, but each one can also have side effects.
Build the model. On chart paper, draw the watershed from today’s Do Now. Add arrows for water flow. Then place cards for the three solutions from 4.08 and trace what each changes downstream.
Worked example 1: tracing a benefit. Priya placed a rain garden below the parking lot. She traced the arrows: less runoff reaches the drain, so less mud and oil reach the wetland, so more light reaches underwater plants, so insects and frogs have more food and cleaner water.
Worked example 2: tracing a side effect. Diego placed a buffer zone along the bank but chose a fast-growing non-native shrub from a garden store. His model showed a risk: the shrub could spread and crowd out native plants, reducing the insects that depend on them. Choosing native shrubs keeps the benefit without that side effect.
Weighing criteria. We now score each solution on our class criteria: impact cut, upkeep time, cost and biodiversity support. Scientific, social and economic factors all count.
Guided Exercises ~15 min
Score the three solutions in a decision matrix (1 = weak, 3 = strong).
| Criterion | Rain garden | Native strip | Buffer zone |
|---|---|---|---|
| Cuts runoff or erosion | |||
| Supports biodiversity | |||
| Fits the sample budget | |||
| Low weekly upkeep | |||
| Risk of side effects (3 = low risk) | |||
| Total |
Independent Practice ~10 min
Argue from your model and matrix.
Using your decision matrix and watershed model, compare two solutions. Explain which better maintains biodiversity and ecosystem services, and describe one side effect each could cause elsewhere in the ecosystem.
How confident are you that you can I can compare design solutions using evidence and criteria.
Closure ~5 min
Next time we look closely at the tools a monitor uses, and what each tool cannot tell us.
Exit ticket: describe one ecosystem service in our watershed and explain how losing biodiversity could weaken it. Use one arrow chain from your model.
Teacher notes
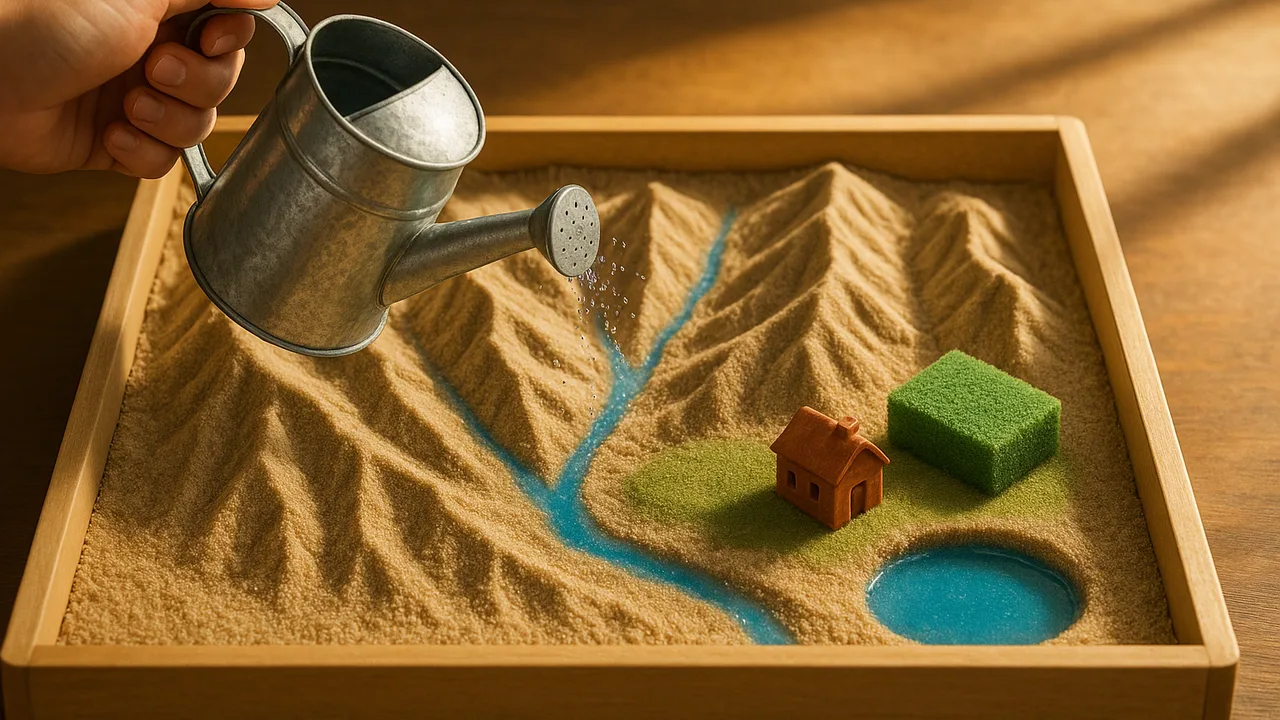
Materials: chart paper, markers, solution cards from 4.08, sticky arrows, decision-matrix handout. Optional: a simple tabletop watershed of crumpled paper under plastic, sprayed with colored water.
Setup: if you build the crumpled-paper watershed, spray water with a few drops of food coloring to show flow paths before teams draw.
Scoring the independent CER (0–2 each): comparison uses evidence; strengths and weaknesses named across scientific, social and economic factors; at least one side effect traced through the system.
Listen for: “all plants are equal.” Native plants support far more local insects than most decorative non-natives. Avoid naming specific invasive species as required knowledge.
Support / stretch: give a pre-drawn watershed. Stretch: add weights to the matrix (for example, biodiversity counts double) and explain how the winner changes.