3.10 Reading the Rock Record: A CER on Fossil Patterns
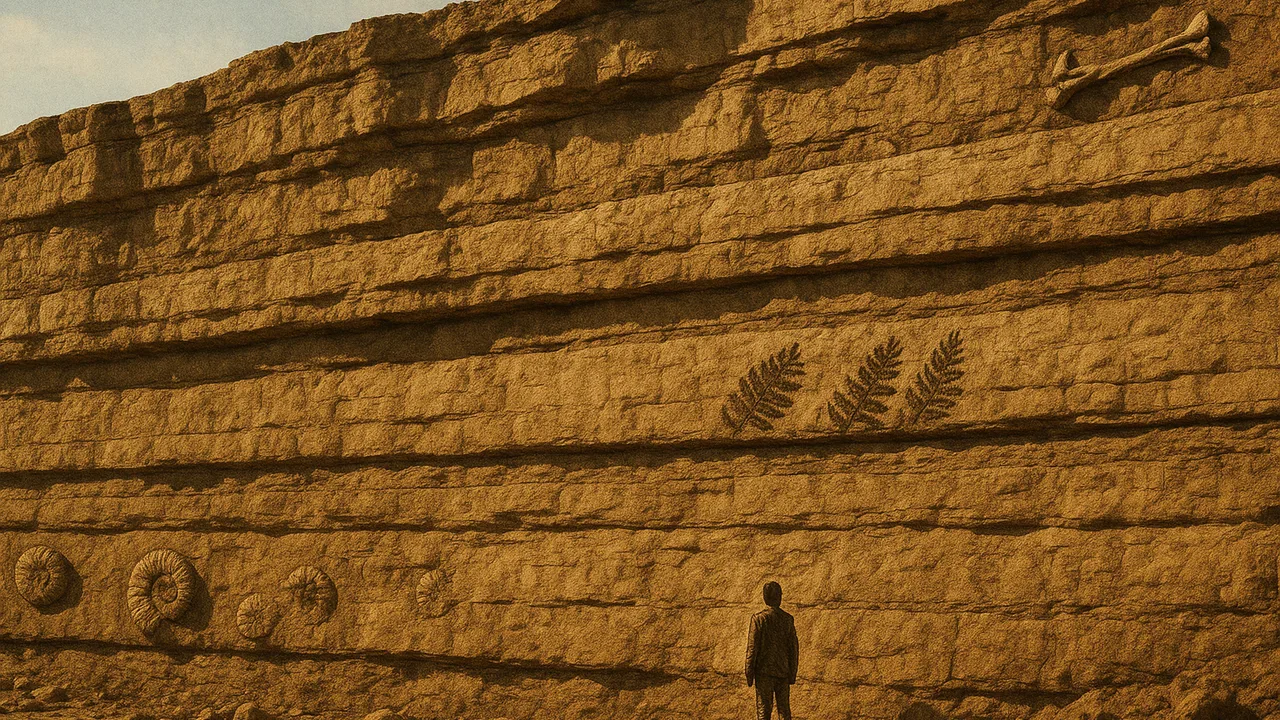
interpret a fossil range chart to argue for when types of life appeared, changed and went extinct, including evidence of a mass extinction.
- I can analyze and interpret fossil data to find evidence for the existence, diversity, extinction, and changes in life forms throughout Earth’s history, using the idea that natural laws work the same way now as in the past.
- I can use patterns in the fossil record to give evidence for when mass extinctions happened.
- I can use similarities and differences in fossil patterns to show when types of organisms appeared, disappeared, or changed over time.
- I can identify patterns between sedimentary rock layers and their relative ages.
- I can find out when a certain fossil organism appears in the fossil record.
- I can identify times when there are big changes in the number or types of organisms in the fossil record, such as layers with many fossils next to layers with few fossils.
Phase 3: Make Sense
Warm-Up ~5 min
Do Now. Compare your 3.03 range chart with another team’s. Both columns used the same fossil key. Name one pattern you share and one difference. Why might two digs not match perfectly?
In very deep, very old rock layers, what kinds of fossils do scientists usually find?
Instruction ~10 min
Reading: what the rock record shows. Earth is about 4.6 billion years old. Across that time, sediment built up layer by layer, burying remains that sometimes became fossils. In undisturbed rock, deeper means older. When scientists line up fossils from many places, clear patterns appear. The deepest fossil layers hold mostly simple life. Younger layers show more kinds of life and more complex bodies. New types appear, some last a long time, and most eventually go extinct.
At a few boundaries, many types vanish at once. These are mass extinctions. The best-known one happened about 66 million years ago, after a large asteroid struck Earth. Dinosaurs, except the ones that led to birds, disappear from layers above that boundary. Other mass extinctions are linked to huge volcanic eruptions and climate change.
Sample range chart. Shaded cells show layers where a type is found. Layer 8 is the oldest.
| Fossil type (sample) | 8 | 7 | 6 | 5 | 4 | 3 | 2 | 1 |
|---|---|---|---|---|---|---|---|---|
| Simple shelled organism | ■ | ■ | ■ | ■ | ■ | ■ | ■ | ■ |
| Segmented sea animal | ■ | ■ | ■ | ■ | ||||
| Armored fish | ■ | ■ | ■ | |||||
| Large reptile | ■ | ■ | ||||||
| Flowering plant | ■ | ■ | ■ | ■ | ||||
| Small mammal | ■ | ■ | ■ | ■ | ||||
| Large mammal | ■ | ■ | ■ |
Worked example 1: appearance and extinction. The armored fish first appears in layer 7 and is last found in layer 5. It appeared after the segmented sea animal and went extinct before flowering plants appear. Notice that between layers 5 and 4, three types vanish: a possible mass extinction.
Worked example 2: a CER. Claim: the kinds of life on Earth have changed over time. Evidence: the oldest layer holds only two simple types; flowering plants and mammals appear only in layers 4 through 1, and large mammals only in the three youngest; three types disappear at the layer 5–4 boundary. Reasoning: sediment settles the same way today as in the past, so lower layers are older. Types that appear only in younger layers did not exist earlier, and types that disappear for good went extinct.
Sentence starters. “I claim that…” “The range chart shows…” “This matters because lower layers …” “Another team might say…, but…”
Guided Exercises ~15 min
Use the sample range chart.
Independent Practice ~10 min
Write your argument.
Write a full CER answering: what does the range chart show about how life on Earth has changed? Use at least three pieces of evidence and the sentence starters.
Describe how a touch station could let a visitor feel the change in variety from deep layers to upper layers.
Closure ~5 min
The rock record shows change through time. Next time, we connect the bones and embryos into one model of relatedness.
Exit ticket: name one fossil type from the chart, state when it appeared and disappeared using layer numbers, and explain how you know which came first.
Teacher notes
Materials: the sample range chart (projected and printed), team range charts from 3.03, CER organizers.
Setup: the chart is invented teaching data built on the real general pattern; types are described, not named as species. Do not introduce era or period names. Remember from Science 8 I: Unit 1 read rock strata for major events, so connect to that work.
Listen for: “all the old animals died at once”. Most extinctions are spread out; mass extinctions are the exception. Also listen for “life gets better over time”: change is not progress toward a goal.
Support / stretch: provide a partially completed CER. Stretch: explain why the shelled organism survived the layer 5–4 boundary when others did not, as a testable hypothesis.