4.02 Our School as a System: Inputs, Outputs and Impacts
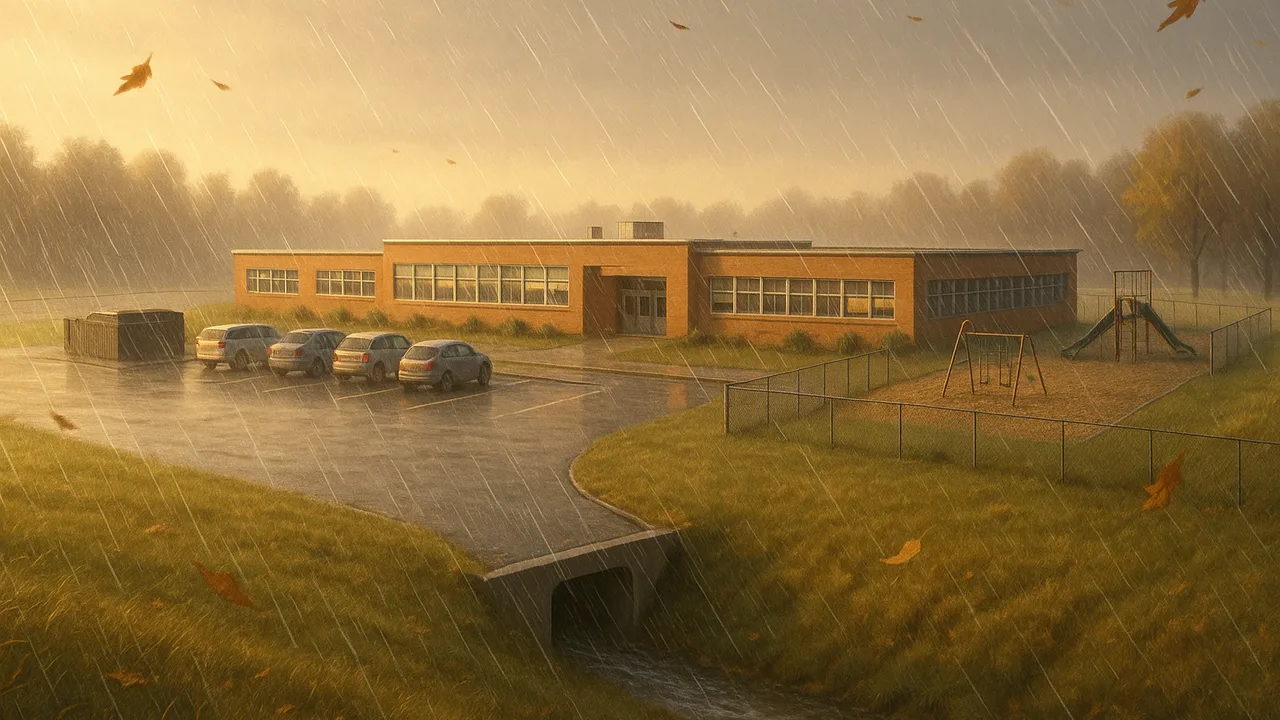
Impact Monitor: Measuring and Shrinking Our Footprint
How do growing populations and our use of resources change Earth, and how can we monitor and reduce our own impact?
The mystery: Over the past century, the number of people on Earth has grown several times over, and so has the use of water, land and energy. Average temperatures have risen. A local wetland that once had many kinds of frogs now has only a few.
model the school as a system of inputs and outputs and explain how each output can cause an effect on Earth’s systems.
- I can explain how a human activity causes negative effects on the environment using scientific principles.
- I can tell the difference between a cause-and-effect relationship and a correlation when I design a solution to an environmental problem.
Phase 1: Spark
Warm-Up ~5 min
Do Now. List everything that comes INTO our school on a normal day, and everything that goes OUT. Try for at least five of each.
Which output of our school is MOST likely to reach the wetland downhill directly?
Instruction ~10 min
Remember from grade 6. Earth’s systems include the geosphere (rock and soil), hydrosphere (water), atmosphere (air) and biosphere (living things). Human activity touches all four.
A building is a system. Inputs cross the boundary into the school: water, electricity, natural gas, food, paper. Outputs leave: wastewater, trash, runoff, heat and carbon dioxide from burning fuel at the power plant or furnace. Each output can push on one of Earth’s systems.
Worked example 1: an input-output map. Jamal drew the school as a box. Arrows in: water, electricity, food. Arrows out: wastewater to the treatment plant, trash to a landfill, runoff to the creek. Then he labeled each arrow with the Earth system it affects. Runoff → hydrosphere and biosphere. Trash → geosphere.
Worked example 2: cause or correlation? Ava noticed that frog counts dropped in the same years the school added a new lot. That is a correlation: two things changed together. To claim a cause, we need a mechanism, such as more runoff carrying warm, oily water into the pond, and evidence that the mechanism happened. Ice-cream sales and sunburns rise together, but ice cream does not cause sunburns; sunny weather drives both.
Why this matters for our monitor. We can only shrink an impact we can measure. The map shows us which arrows could be measured weekly.
Guided Exercises ~15 min
Build the system map with your team, then test your thinking.
Independent Practice ~10 min
Finish your team’s system map on chart paper.
Circle the two outputs you think a student team could measure every week. Explain why each one is measurable and why it matters.
Closure ~5 min
Next time, we zoom out to the whole planet: graphs of population and resource use over the past century.
Exit ticket: explain how one school output causes a negative effect on an Earth system. Then name one extra piece of evidence that would show it is a cause, not just a correlation.
Teacher notes
Materials: chart paper, markers in four colors (one per Earth system), a simple outline map of the school grounds showing downhill direction if available.
Setup: model one arrow on the board before teams start. Keep the maps; they become the starting point for the 4.04 audit and 4.13 monitor choices.
Listen for: “wastewater goes straight to the creek.” Sink and toilet water usually goes to a treatment plant; storm drains often do not. Check how your own building drains before stating it. Also listen for causal claims built only on timing.
Support / stretch: provide a partly drawn map with three arrows in place. Stretch: add a feedback loop, such as hotter summers raising electricity use for cooling.