3.24 Visitor Test Day: Testing Against the Criteria
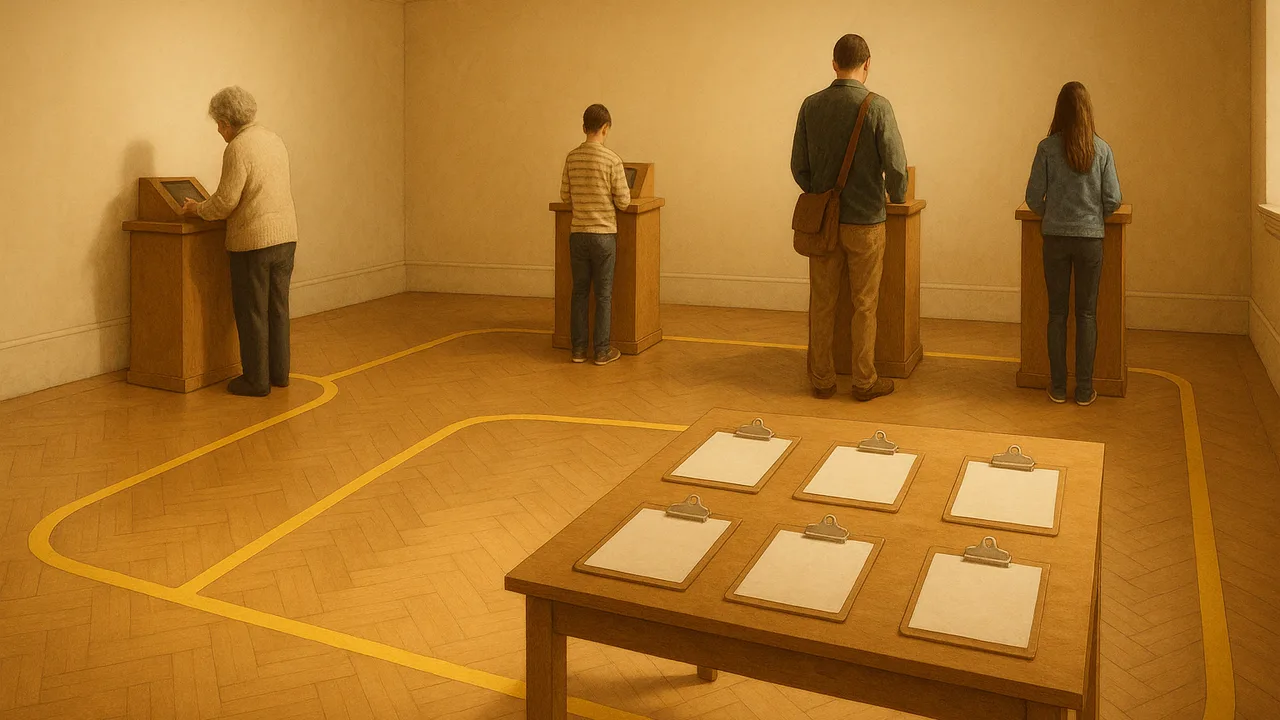
test the exhibit with ten visitors, compare the data with every class criterion, and decide on one final fix.
- I can define the criteria for a solution that meet the needs of the people or groups affected by the problem.
- I can explain who the solution is meant to help and use criteria to compare different solutions, including using numbers when needed.
- I can use a systematic method, like a decision matrix, to find the strengths and weaknesses of each solution.
- I can evaluate each solution using the criteria and constraints we defined.
- I can compare the solutions based on how well they meet the criteria and constraints.
- I can use evidence and reasoning to make a claim about which solution works best, based on their strengths and weaknesses.
Phase 5: Prove It
Warm-Up ~5 min
Do Now. Write the five class criteria from memory. Next to each, write how we will measure it today.
How will we measure “at least 8 of 10 test visitors can explain one piece of evidence afterward”?
Instruction ~10 min
Designers, today ten visitors decide. They might be students from another class, staff or family members. None of them has seen our exhibit.
Our class criteria, from 3.09:
- every station uses at least 2 senses;
- a visitor can finish a station in under 3 minutes;
- at least 8 of 10 test visitors can explain one piece of evidence afterward;
- it is accessible to a visitor who cannot see or cannot hear;
- it stays within the sample materials budget.
Test plan. 1. Each visitor walks the four stations alone. 2. A Timer records minutes at each station. 3. A Counter tallies which senses the visitor used. 4. At the exit, an Interviewer asks: “Tell me one piece of evidence that life has changed over time.” and records whether the answer is correct. 5. At least one visitor tests with a sleep mask and guide, and one with earmuffs. 6. The Budget Keeper totals the sample costs.
Worked example 1: reading test data (sample data).
| Station | Senses used | Average time (min) | Longest time (min) | Met criteria? |
|---|---|---|---|---|
| Fossil layers | touch, hearing, sight | 2.2 | 2.8 | yes |
| Comparing limbs | touch, sight | 1.9 | 2.5 | yes |
| Embryos | touch, hearing, sight | 2.6 | 3.4 | time: no |
| Ecosystems | touch, sight | 2.4 | 2.9 | yes |
Exit interviews: 8 of 10 visitors explained one piece of evidence correctly. Sample budget: $118 of $120 spent. Kofi’s analysis: “We met four criteria fully. The embryos station averaged under 3 minutes, but one visitor needed 3.4 minutes, so we did not meet the criterion for every visitor. Our final fix: cut the audio clip from 30 to 15 seconds.”
Worked example 2: honest limits. Mei added: “Only one no-sight visitor and one no-hearing visitor tested. That is a small sample, so we will tell the museum that more testing would help.” Naming a limitation makes the results more trustworthy, not less.
Guided Exercises ~15 min
Collect your data, then analyze it with these.
Independent Practice ~10 min
Write the test report the museum will read.
Claim: did our exhibit meet the museum's criteria? Evidence: at least three numbers from today's test. Reasoning: explain which criteria were met, which were not, and your final fix. Name one limitation of the test.
Closure ~5 min
Data in hand, designers. Next class is Museum Opening Night.
Exit ticket: which criterion was hardest to meet, and what does that tell you about designing for real visitors?
How confident are you that you can I can evaluate a solution using the criteria and constraints we defined.
Teacher notes
Materials: version 2 exhibit, timers, tally sheets, exit interview cards, sleep masks and earmuffs, wipes, budget sheets.
Setup: arrange ten test visitors in advance (another class, staff or volunteers). Assign roles: Timer, Counter, Interviewer, Guide, Budget Keeper. Run visitors in pairs of teams to keep the time to about 25 minutes. All numbers in the example are sample data.
Listen for: averages used to hide a failing visitor; “we met it because most people liked it”; teams that skip the limitation.
Support / stretch: give a pre-built scorecard. Stretch: graph each station’s times as a dot plot and mark the 3-minute line.