4.07 Nature’s Free Services: Filtering Water and Holding Soil
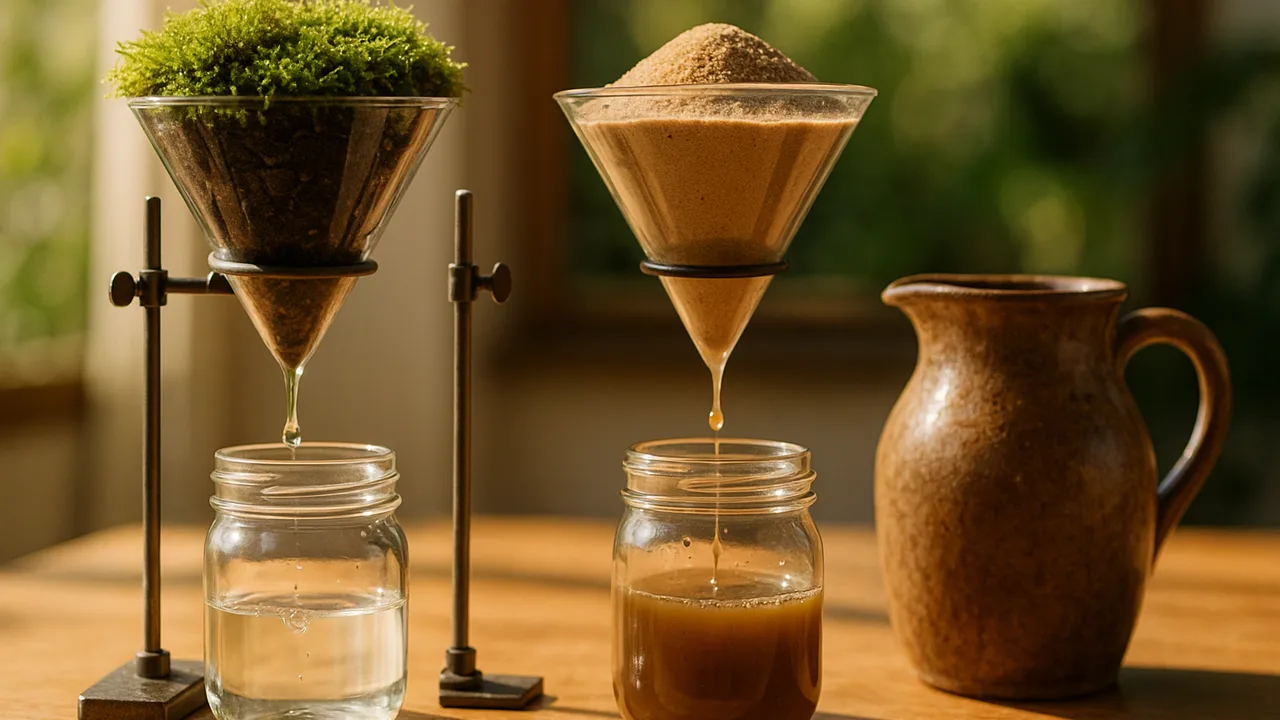
test how soil and plants filter muddy water and hold soil in place, and describe how these ecosystem services keep an ecosystem stable.
- I can identify and describe data about the types and numbers of species in an ecosystem.
- I can explain what factors can affect how stable the biodiversity is in an ecosystem.
- I can describe ecosystem services, like water purification or soil erosion prevention, and how they help keep the ecosystem stable.
Phase 2: Investigate
Warm-Up ~5 min
Do Now. A water treatment plant cleans water using layers of sand and gravel. Where in nature might water get cleaned in a similar way? Jot two ideas.
We pour muddy water through three bottle filters: gravel only, soil and sand, and soil with growing grass on top. Which comes out clearest?
Instruction ~10 min
Explore first. Two tests run side by side. Test 1, filtering: pour 250 mL of the same muddy water through three upside-down bottle filters and rate the clarity of what drips out on a 1 (clear) to 5 (very muddy) card. Test 2, erosion: sprinkle 500 mL of rain on a tilted tray of bare soil and a tray of soil with grass roots, then measure how much soil washes into the cup after the water settles.
| Setup | Water in (mL) | Water out (mL) | Clarity (1–5) | Soil washed out (mm settled in cup) | Notes |
|---|---|---|---|---|---|
| Filter: gravel only | 250 | — | |||
| Filter: soil + sand | 250 | — | |||
| Filter: soil + grass | 250 | — | |||
| Erosion: bare soil | 500 | ||||
| Erosion: soil with roots | 500 |
Name the ideas. Ecosystem services are benefits people get from healthy ecosystems. Wetlands and soils purify water by trapping particles and letting microbes break down some pollutants. Roots control erosion by binding soil. Decomposers recycle nutrients. Many species doing different jobs make these services steadier. When biodiversity drops, an ecosystem can lose a service and recover more slowly from storms or drought.
Worked example 1: reading the clarity data. Sample data: gravel only scored 4, soil + sand scored 3, and soil + grass scored 2. The more layers and roots the water passed through, the clearer it came out.
Worked example 2: species data. Sample data from the watershed group: 20 years ago, a wetland survey found 7 frog species and 25 kinds of plants along the edge. This year it found 3 frog species and 12 kinds of plants, and the bank where plants were lost is eroding. Fewer species and a weaker service appeared together. Our filter and erosion tests suggest a mechanism: fewer plants means less soil held and less water cleaned.
Guided Exercises ~15 min
Use both data tables. Discuss each card with your team.
Independent Practice ~10 min
Explain the link between biodiversity and services.
Describe two ecosystem services the wetland gives our town. Use one result from today's tests to explain how each service works.
Use the sample survey data to explain one factor that could make the wetland's biodiversity less stable.
Closure ~5 min
If plants and soil do this much work, how do we protect or add them? Next time we compare three design solutions.
Exit ticket: describe one ecosystem service, explain how it keeps the wetland stable, and name the data from today that supports your answer.
Teacher notes
Materials (per team): three 2 L bottles with bottoms removed (teacher-cut, edges taped), coffee filters or cloth for the necks, gravel, sand, garden soil, a small square of grass sod or a cup of grass grown for a week, muddy water (soil stirred into tap water), clear cups, a 1–5 clarity card, two erosion trays from 4.05, a ruler.
Setup: stir the muddy water before every pour so each filter gets the same mix. Let the erosion cups settle for 5 minutes, then measure the layer of settled soil.
Listen for: “the filtered water is clean enough to drink.” Clear is not the same as safe; germs and dissolved chemicals can remain. The survey numbers are sample data; do not present them as a real site.
Support / stretch: provide a sentence frame: “The ___ provides ___, which helps the ecosystem by ___.” Stretch: design a fourth filter with a layer you choose and predict its score.