4.17 How Others Monitor: Citizen Science on Streams and Air
explain how community volunteers monitor streams and air, and name the strengths and limits of the tools they use.
- I can use scientific information to design a solution that addresses the effects of a specific human activity on the environment.
- I can include technologies in my design that help monitor and reduce the negative impacts of human activities on the environment.
- I can identify the limitations of the technologies used in my solution.
- I can identify evidence about how human population size has changed in a region or ecosystem over time.
- I can identify evidence about how much natural resources people use in a region or ecosystem over time.
- I can identify evidence showing how Earth’s systems have changed in a region or ecosystem over time.
Phase 4: Build
Warm-Up ~5 min
Do Now. Imagine you could pick up one rock from the bottom of the local creek. What could the tiny animals living under it tell you about the water? Write one guess.
Volunteers flip rocks in a creek and find many mayfly, stonefly and caddisfly larvae. What does that most likely tell them?
Instruction ~10 min
You are not the first monitor builders. Across many countries, ordinary people collect environmental data that scientists and towns use. This is called citizen science. Today’s case study looks at two common kinds: stream monitoring and air monitoring.
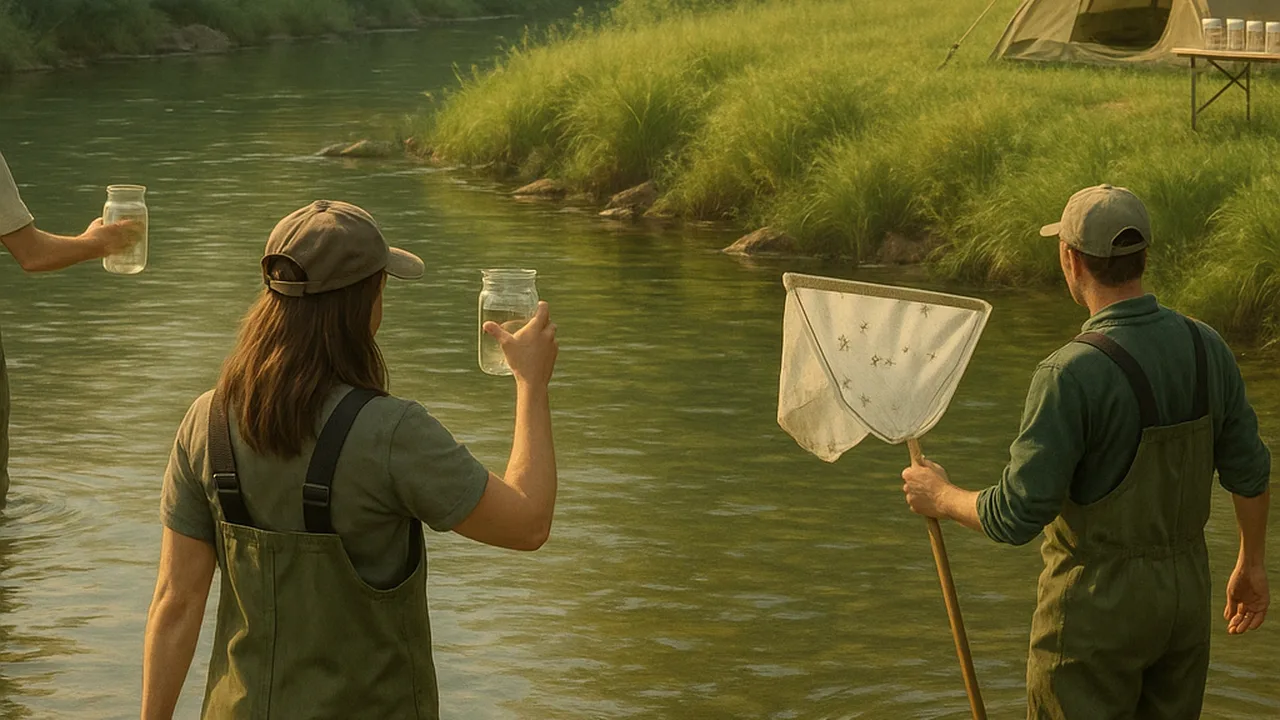
Stream monitoring. Trained volunteers visit the same spot on a stream, often every month or season. They measure water temperature, how cloudy the water is, and sometimes dissolved oxygen. They also count small animals without backbones, called macroinvertebrates. Because some of these animals cannot survive in polluted water, the mix of animals tells a story that one reading cannot.
Air monitoring. Some communities place low-cost sensors on porches, schools or poles. Many measure tiny particles in the air, which come from traffic, burning and dust. The readings appear on shared maps. Low-cost sensors are cheaper and more numerous than official monitors, but they can drift or read high in humid air, so they are checked against official stations.
Worked example 1: reading a stream score. Sample data. At Site 1, upstream of a new parking lot, volunteers found 6 sensitive kinds of larvae. At Site 2, downstream, they found 2. Sofia reasons: “The lot adds runoff with sediment and oil. Sediment smothers the rocks where larvae live. So the drop is likely caused by the runoff.” She also notes a limit: “One visit is not enough; I would check again after dry weather.”
Worked example 2: a tool’s limits. Sample data. A school’s air sensor reads much higher on a foggy morning than the official station across town. Omar asks, “Is the air really worse, or is the sensor fooled by the moisture?” Naming a tool’s limits is part of good design, not a failure.
Population and use. When a town grows, it usually adds roofs, roads and lots. More people times more pavement per person means more runoff. Long-term volunteer records help show those changes over time.
Guided Exercises ~15 min
Use the case study to answer each block.
Independent Practice ~10 min
Connect the case study to our project.
Explain how a human activity near the creek (such as paving, mowing to the edge, or littering) causes an effect on the stream's living things. Use cause-and-effect reasoning.
Name two limitations of our school monitor's tools (the scale, the water meter or a rain gauge). For each one, describe how you could reduce the problem.
🔎 Mini case study: Case study: Volunteers Watching Streams and Air ~6 min
In many communities, volunteers are trained to monitor local streams. They return to the same sites, record temperature and water clarity, and count stream insects and other small animals. Over years, their records can show whether a stream is getting healthier or worse, and help towns decide where to plant buffers or fix runoff problems.
Other communities set up networks of small air sensors at homes and schools. Their maps show where tiny particles in the air are higher, such as near busy roads. Scientists caution that these sensors need checking against official monitors, but together they give a much more detailed picture than a few official stations alone.
Both kinds of projects share three lessons for us: measure the same way every time, keep records for a long time, and be honest about what your tools cannot do.
Think about it: Which of the three lessons will be hardest for our monitor to follow, and what will you do about it?
Closure ~5 min
Citizen scientists show that careful, simple routines make strong data. Next class you will turn your hybrid into a data-log model.
Exit ticket: what is one habit of citizen scientists that our monitor must copy? Explain why it makes data more trustworthy.
How confident are you that you can I can explain how a monitor tracks a human impact and name the limits of its tools.
Teacher notes
Materials: pictures of common stream macroinvertebrates (sensitive and tolerant), a photo of a low-cost air sensor, the case study on a slide.
Setup: the case is kept general on purpose. If your area has a volunteer stream or air program, a guest speaker or short video works well. All site numbers in the lesson are sample data.
Listen for: “bugs in the water means it’s dirty” (the opposite is often true for sensitive larvae); claims that are stronger than one visit can support.
Support / stretch: give a sorting card set of sensitive and tolerant animals. Stretch: design a sampling schedule that controls for rainy weeks.