4.14 Ideate: Brainstorming the Impact Monitor
use scientific information to generate and choose impact-monitor designs that measure and reduce a human impact and support biodiversity.
- I can use scientific information to design a solution that addresses the effects of a specific human activity on the environment.
- I can include technologies in my design that help monitor and reduce the negative impacts of human activities on the environment.
- I can describe how well my solution meets the needs and limits I identified, including how it monitors or reduces a human impact based on scientific ideas about Earth systems.
- I can use scientific evidence to compare how well each design solution maintains ecosystem stability and biodiversity.
- I can explain the strengths and weaknesses of each design solution based on different criteria and constraints, such as scientific, social, and economic factors.
- I can assess possible side effects that each design solution might have on other parts of the ecosystem, including how a small change in one part could lead to big changes elsewhere.
Phase 3: Make Sense
Warm-Up ~5 min
Do Now. Reread the Wonder Board from 4.01. Put a check next to every question we can now answer, and a star next to any we still need to solve with our design.
Which brainstorm rule produces the most useful ideas?
Instruction ~10 min
Reading: what makes a strong monitor design. A strong design starts from science. Our runoff tests showed that pavement sends most rain downhill, so runoff is worth measuring. Our audit showed that small per-person uses add up, so water or energy is worth measuring. Our filter and erosion tests showed that plants and soil provide services, so adding native plants can support biodiversity. The monitor needs a reduction action too, such as faucet reminders, a lights-off routine or a rain garden. The action must be big enough to cut one impact by at least 10% in a 2-week sample test. Every tool has limits, so a good design names them and plans around them.
Worked example 1: idea to plan. Ava’s team combined ideas. Measure: roof runoff (bucket) and classroom energy (meter). Action: a “last one out” lights routine. Biodiversity: plant a native strip by the downspout. Sample cost $40 + $45 seed and plants = $85. Weekly time 4 minutes. Every criterion has a plan.
Worked example 2: a weak idea, improved. Malik’s first idea was a poster asking people to save water. It measures nothing and supports no species. He added a weekly faucet-flow check at three sinks and a sink-side reminder, then linked the saved water to a watering can for the rain garden. Now it measures, acts and supports biodiversity.
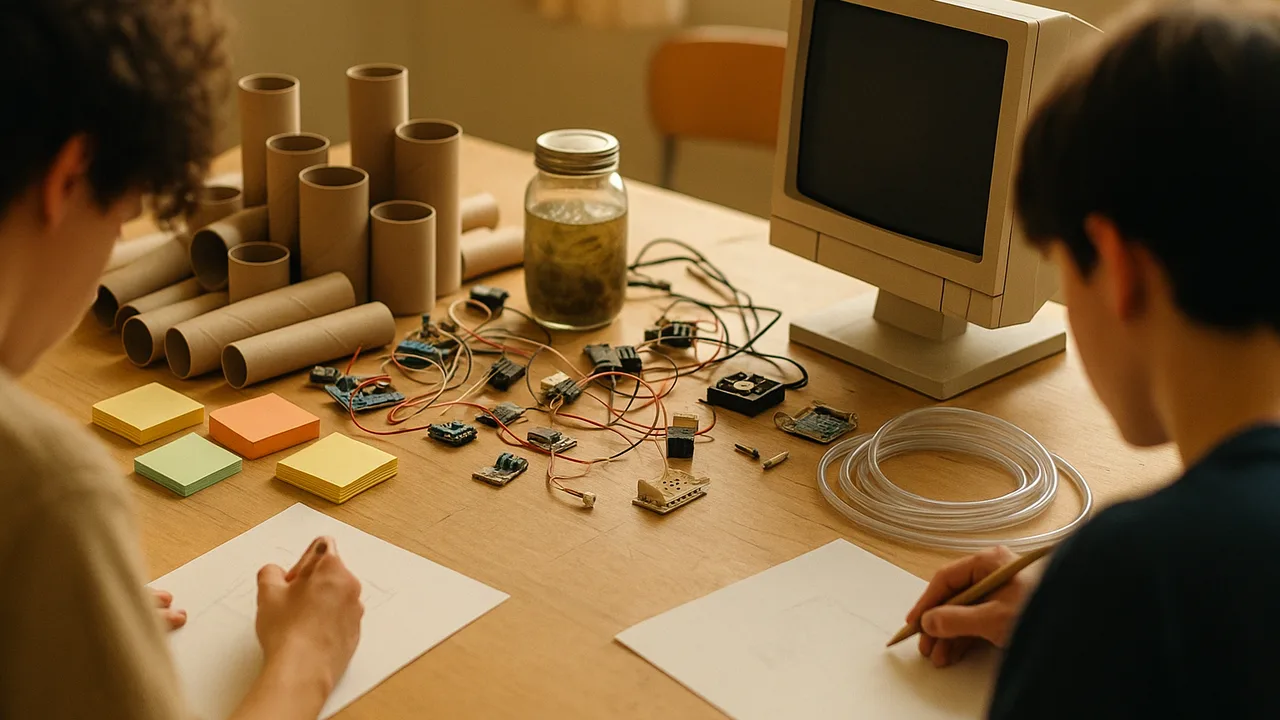
Ideate protocol. Silent sketch (5 min), team share with “Yes, and…” (8 min), then score the top three ideas in the decision matrix below.
Guided Exercises ~15 min
Score your team’s top three ideas (1 = weak, 3 = strong).
| Criterion | Idea A | Idea B | Idea C |
|---|---|---|---|
| Measures at least 2 impacts weekly | |||
| 1 action that could cut an impact by 10% in 2 weeks | |||
| Runs in under 10 minutes a week | |||
| Costs under the $150 sample budget | |||
| Supports local biodiversity | |||
| Total |
Independent Practice ~10 min
Choose and justify.
Describe your team's chosen monitor: the two impacts it measures, its tools, its reduction action and how it supports biodiversity. Explain the science behind each choice and how well it meets each criterion.
Compare your chosen idea with your runner-up. Explain the trade-off you made and one side effect you will watch for.
Closure ~5 min
Our ideas are chosen. In Build, we turn them into working prototypes and start testing.
Exit ticket: in three sentences, explain how your monitor will measure and reduce one human impact on the environment, and which evidence from our investigations supports it.
Teacher notes
Materials: sketch paper, chart paper, the class criteria poster, decision-matrix handouts, the 4.13 tool table and sample price list.
Setup: time the silent sketch and team share. Collect each team’s chosen design and matrix; part 2 starts its prototype lessons from them.
Listen for: awareness-only ideas (posters) with no measurement, and plans that ignore time or budget. Remind teams the 10% cut is measured against a baseline over 2 weeks.
Support / stretch: provide a design template with labeled boxes (measure, act, support biodiversity, cost, time). Stretch: plan how to share the weekly data with the watershed group, such as a simple shared chart.