4.05 Pavement vs Grass: Modeling Runoff
measure runoff from model pavement and grass surfaces and explain how paving land causes negative effects on water and living things downstream.
- I can explain how a human activity causes negative effects on the environment using scientific principles.
- I can tell the difference between a cause-and-effect relationship and a correlation when I design a solution to an environmental problem.
- I can use scientific information to design a solution that addresses the effects of a specific human activity on the environment.
- I can include technologies in my design that help monitor and reduce the negative impacts of human activities on the environment.
Phase 2: Investigate
Warm-Up ~5 min
Do Now. Your teacher pours 200 mL of water onto a kitchen sponge and onto a flat plastic lid. Describe what happens to the water on each surface.
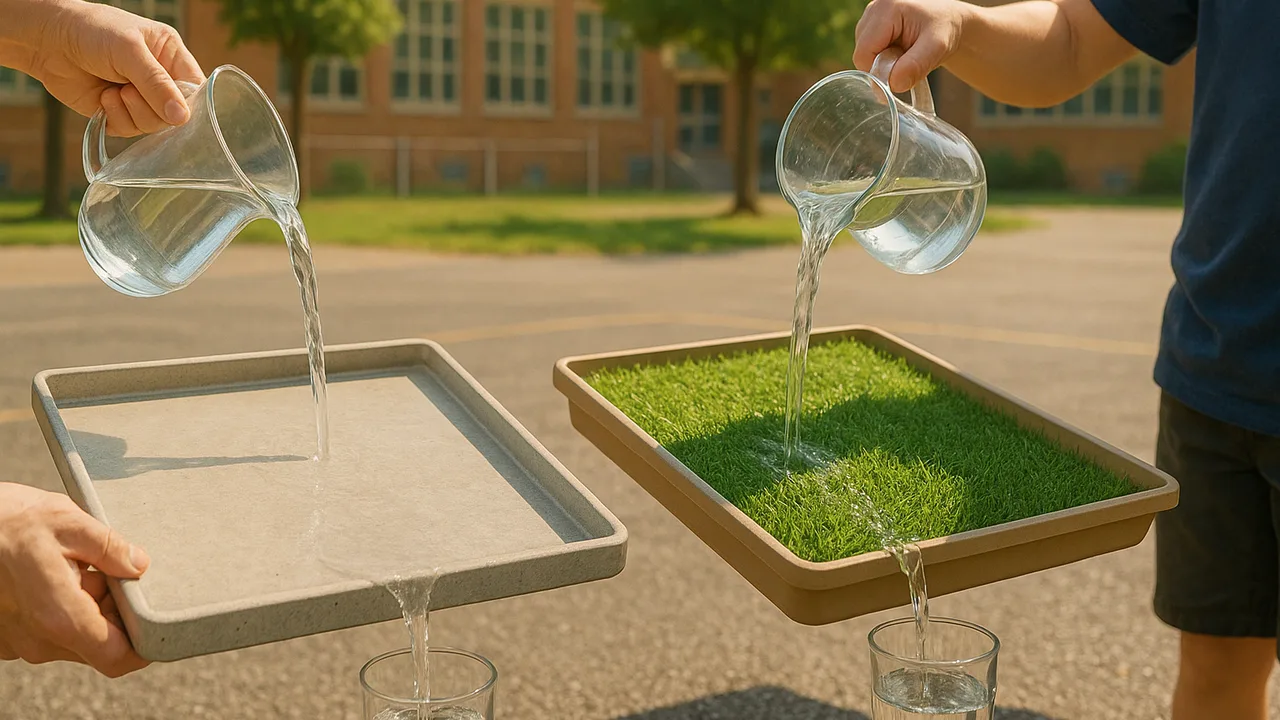
We pour the same rain on a tilted tray of grass sod and a tilted tray of plastic “pavement.” Which collects more runoff?
Instruction ~10 min
Explore first. Each team builds two tilted trays, propped on one book, with a cup at the low end. Tray A is covered with plastic sheet or foil (pavement). Tray B holds a piece of sod or damp soil with grass. Sprinkle 500 mL of “rain” from a watering can over 30 seconds. Measure the runoff and note its color.
| Surface | Rain added (mL) | Runoff trial 1 (mL) | Runoff trial 2 (mL) | Average runoff (mL) | Percent that ran off | Runoff color / clarity |
|---|---|---|---|---|---|---|
| A: pavement | 500 | |||||
| B: grass | 500 | |||||
| C: bare soil (optional) | 500 |
Name the ideas. An impervious surface, such as asphalt, concrete or a roof, does not let water soak in. A pervious surface, like soil with plants, allows infiltration. More pavement means more runoff, faster floods in streams, more erosion of stream banks and more pollutants washed in. Less water soaks in to refill groundwater.
Worked example 1: percent runoff. Sample data: the pavement tray collected 450 mL of 500 mL. 450 ÷ 500 = 0.90, or 90%. The grass tray collected 100 mL: 100 ÷ 500 = 0.20, or 20%.
Worked example 2: comparing surfaces. Sample data: in our model, pavement sent 90 ÷ 20 = 4.5 times as much water downhill as grass. On a real lot, a surge like that can scour a creek bank and wash oil, litter and warm water into the wetland.
Limits of a model. Our trays are small, tilted the same way, and use tap water. Real land has different slopes, soils and storm sizes. The model shows the direction of the effect, not the exact amount for our lot.
Guided Exercises ~15 min
Use your runoff table. Discuss each card with your team.
Independent Practice ~10 min
Connect the model to the real wetland.
Explain, step by step, how paving land uphill of the wetland could reduce the number of frog species. Use your runoff percents as evidence.
Name one simple tool, such as a rain gauge or a marked bucket under a downspout, that could monitor runoff at school. What would it measure, and how often?
Closure ~5 min
Next time, we turn to a planet-sized question: what global temperature data shows over the past century.
Exit ticket: use scientific ideas about infiltration to explain why paving land causes a negative effect downstream. Include one limitation of our tray model.
Teacher notes
Materials (per team): two shallow trays or foil roasting pans with a notch cut at one end, plastic sheet or foil, a piece of sod or a tray of damp soil with grass seedlings, a watering can with a sprinkler head, a 1 L measuring cup, a collection cup, books for tilt, paper towels, a plastic bin to catch spills.
Setup: water the soil trays the day before so they behave like damp ground; very dry soil can shed water at first. Pour at a steady rate over 30 seconds. Save one bare-soil tray for 4.07’s erosion test.
Listen for: “the grass absorbs the water and it’s gone.” The water soaks into soil and becomes groundwater or is taken up by plants; it is not destroyed. Numbers in the worked examples are sample data.
Support / stretch: give a percent frame: ___ ÷ 500 × 100 = ___%. Stretch: add a mulch or gravel tray and predict where it falls between pavement and grass.