4.26 Unit 4 Checkpoint: People, Resources and a Changing Planet
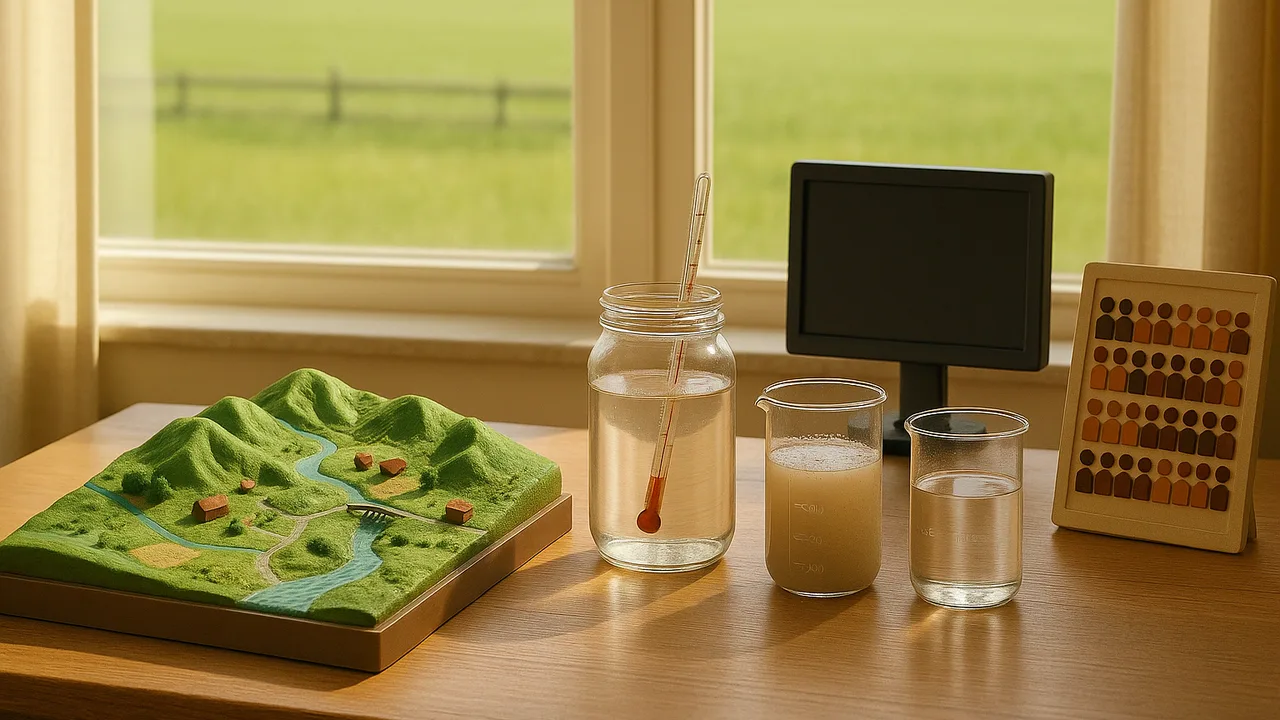
show what I learned about human impact, population and resource use, rising temperatures, biodiversity and design testing across the unit.
- I can make a claim, supported by evidence, that increases in human population and per-person use of natural resources affect Earth’s systems.
- I can use scientific evidence to compare how well each design solution maintains ecosystem stability and biodiversity.
- I can explain the strengths and weaknesses of each design solution based on different criteria and constraints, such as scientific, social, and economic factors.
- I can assess possible side effects that each design solution might have on other parts of the ecosystem, including how a small change in one part could lead to big changes elsewhere.
- I can make a claim about which characteristics of each design best meet the criteria and constraints, using evidence from the data.
Phase 5: Prove It
Warm-Up ~5 min
Do Now. Back to our phenomenon: a local wetland once had many kinds of frogs and now has only a few. In two sentences, explain one way human activity upstream could cause that change.
Total resource use can rise even when each person uses less, if the population grows fast enough.
Instruction ~10 min
Monitor builders, this is the unit checkpoint. It is set up like the PSSA: multiple choice with data, a scenario set, and short constructed responses scored 0–2. Read each question twice, mark the data you use, and show your reasoning.
Quick review 1: people, resources and climate. Total resource use = people × use per person. More use changes Earth’s systems: wetlands are filled, rivers run lower, more fuel is burned. Global average temperature has risen about 1 °C since the late 1800s, mainly because burning fossil fuels adds carbon dioxide to the air. Strong questions about climate data name the data, a pattern and a possible cause.
Quick review 2: monitoring, biodiversity and design. A monitor measures an impact the same way again and again so changes show. Percent change = change ÷ baseline × 100. Native plantings and rain gardens support biodiversity and ecosystem services such as water purification and erosion control. Engineers organize test data, combine the best features, test models and name their limits.
Worked example 1: a strong data answer. Question: “Runoff fell from 50 L to 40 L. What is the percent change?” Malik wrote: “50 − 40 = 10 L; 10 ÷ 50 = 0.2; 0.2 × 100 = 20% decrease.” Every step and the units are shown.
Worked example 2: a 2-point constructed response. Question: “Why might a rain garden help frogs downstream?” Sofia wrote: “A rain garden soaks up roof runoff, so less sediment and pollution reach the creek (cause). Cleaner water keeps the wetland a better habitat for frog eggs and tadpoles (effect).” Claim, mechanism and effect: full credit.
Guided Exercises ~15 min
Part A: multiple choice and scenario set. Work on your own. Scenario: a growing town tested three ways to protect the creek that runs through a new neighborhood (sample data).
| Design | Runoff reaching creek (% of rain) | Insect kinds in creek after 1 year | Cost |
|---|---|---|---|
| No change (lawn to the edge) | 60% | 4 | $0 |
| Native plant buffer strip | 35% | 9 | Medium |
| Rain gardens on every block | 25% | 10 | High |
Independent Practice ~10 min
Part B: constructed responses, scored 0–2.
(2 points) Using the scenario table, write a claim about which design best protects biodiversity and ecosystem services. Cite two numbers and name one possible side effect of your choice.
(2 points) A school's data-log model gave a green flag for a 20% drop in trash during a week with a holiday. Explain the model's limitation and one change to its calculations that would fix it.
(2 points) Explain how population growth AND per-person resource use together affect one of Earth's systems. Then describe how a monitor like ours could reduce one human impact.
Closure ~5 min
Checkpoint complete. The next two lessons review grades 6–8 science for the PSSA.
Exit ticket: which question on today's checkpoint felt hardest? Write what you would review before trying it again.
How confident are you that you can I can explain human impacts on Earth and evaluate solutions with data.
Teacher notes
Materials: printed checkpoint or the online version, calculators, the scenario table.
Answer key notes: food waste 25 → 21 kg is a 16% cut; population 30,000 → 45,000 is 1.5 times. All scenario numbers are sample data.
Scoring (0–2): 2 = accurate claim, two pieces of evidence and reasoning that names a mechanism; 1 = claim with partial evidence or reasoning; 0 = no relevant evidence. For the model item: 2 = names fewer school days as the cause and proposes per-day normalizing; 1 = one of those; 0 = neither.
Support / stretch: read-aloud and extended time per IEPs; a formula card for percent change. Stretch: add a fourth design to the scenario and predict its results with reasons.