3.20 Prototype Station 4: How Ecosystems Change Populations
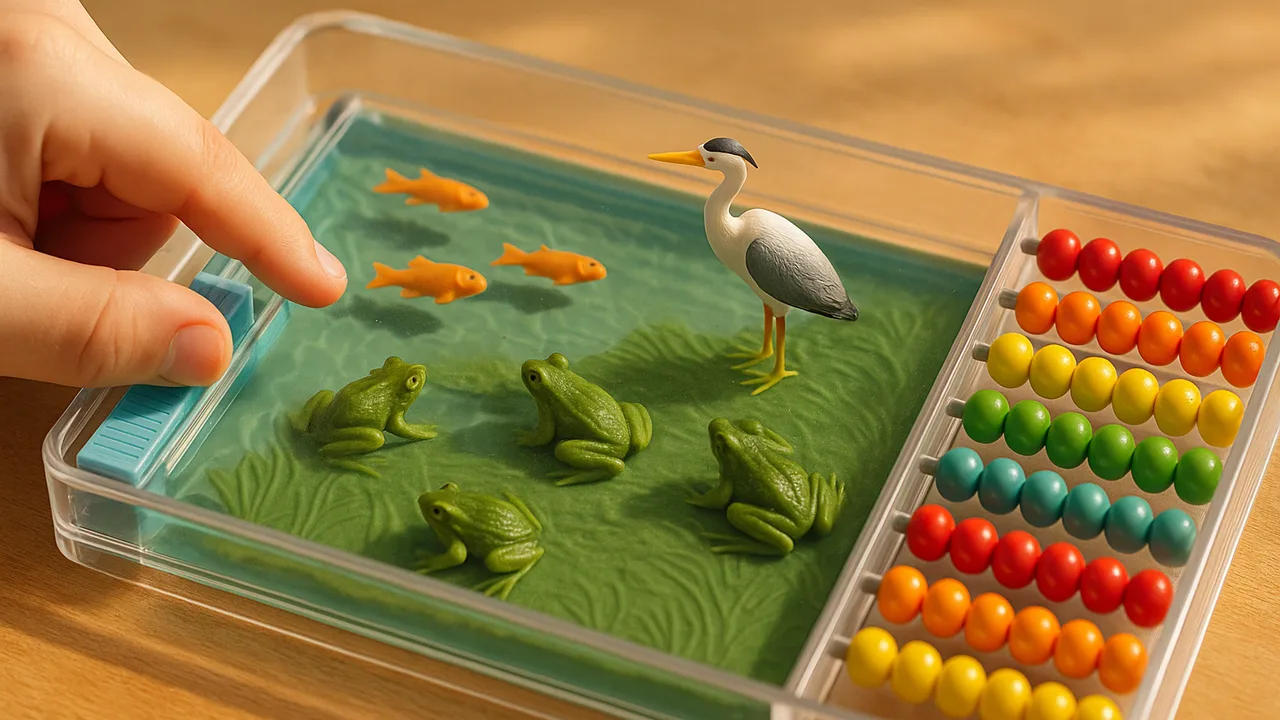
build a station that uses data to argue how changes in an ecosystem’s physical or biological parts change its populations.
- I can make a claim that changes to physical or biological parts of an ecosystem can affect the populations living there.
- I can describe evidence about changes in the physical or biological parts of an ecosystem, including how big those changes are.
- I can describe evidence about changes in populations, including how big those changes are and what types of species are present.
- I can identify evidence that shows whether changes in ecosystem parts are related to changes in populations, including both cause-and-effect and patterns.
- I can use reasoning to connect evidence to my claim and construct an argument about how changes in physical or biological parts of an ecosystem can cause changes in populations.
- I can explain how specific changes in an ecosystem can affect the survival and reproduction of organisms, and how these factors can change populations.
- I can describe patterns in evidence that show many types of changes in ecosystem parts are linked to changes in populations, including how small changes can lead to big effects.
Phase 4: Build
Warm-Up ~5 min
Do Now. Remember from grade 6: an ecosystem has living parts and nonliving parts. List two of each for a pond.
Which is a PHYSICAL (nonliving) part of a pond ecosystem?
Instruction ~10 min
Designers, the last station connects the deep past to today. The fossil record shows that populations rise, fall and sometimes disappear. One big reason is that ecosystems change.
The science. An ecosystem has physical parts (water, temperature, sunlight, soil) and biological parts (plants, animals, other organisms). When any part changes, the organisms that depend on it may survive and reproduce more or less. That shifts the size of their populations. Small changes can lead to big effects, because organisms are linked through food webs.
Worked example 1: a physical change (sample data).
| Year | Summer rainfall (cm) | Frogs counted | Dragonfly larvae per net sweep |
|---|---|---|---|
| 1 | 30 | 120 | 15 |
| 2 | 28 | 115 | 14 |
| 3 | 12 | 60 | 6 |
| 4 | 10 | 40 | 4 |
| 5 | 27 | 70 | 11 |
Sample data for a local pond. Mei’s argument: “Claim: the drought caused the frog population to drop. Evidence: when rainfall fell from about 30 cm to 10 cm, frogs fell from 120 to 40. Reasoning: less water means less space to lay eggs and fewer insects to eat, so fewer frogs survive and reproduce. When rain returned, frogs began to recover.”
Worked example 2: another interpretation. Diego asks: “Could something else explain it, like a new predator?” Good scientists check. Dragonfly larvae, which frogs eat, dropped at the same time, and no new predator was recorded. A second source, a weather record, matches the rainfall data. Together the evidence best supports the drought explanation.
A biological change. If a predator is removed from a forest, the animals it ate may increase, and then the plants they eat may decrease. One change ripples through the food web.
Guided Exercises ~15 min
Use the sample pond data.
Independent Practice ~10 min
Write the argument your station will tell.
Write a CER for the pond data. Claim: how did the drought affect the frogs? Evidence: at least two numbers from two columns. Reasoning: explain survival and reproduction. End with one other explanation and why the evidence fits yours better.
Connect to the fossil station: how is a mass extinction like the pond drought, only much bigger?
Closure ~5 min
All four stations now have a version 1. Next class: the mid-build checkpoint.
Exit ticket: name one physical change and one biological change that could shift a population, and predict the effect of each.
How confident are you that you can I can make a claim that changes to physical or biological parts of an ecosystem can affect populations.
Teacher notes
Materials: printed sample data tables, graph paper, tokens or beans, sliders made from cardboard, a recorder or phone for audio.
Setup: all pond numbers are sample data; say so out loud. If your class collected real ecosystem data in Part 1, swap it in. Have students graph rainfall and frogs on the same time axis.
Listen for: “the frogs decided to leave” (populations change through survival and reproduction); one-cause thinking; correlation claimed without a reason.
Support / stretch: give a CER frame with the numbers already circled. Stretch: predict year 6 and explain what extra data would make the prediction stronger.