4.24 Harvest Day: Testing the Grow Lab Against the Criteria
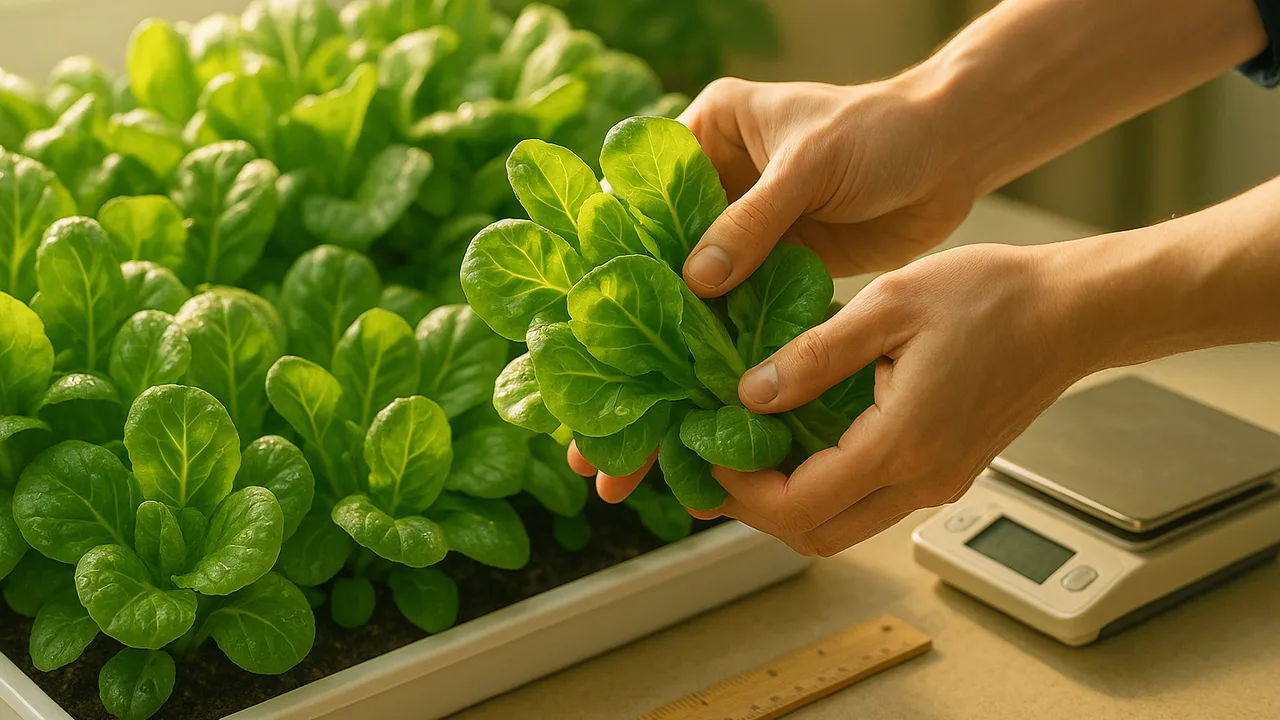
harvest our greens, measure every criterion and constraint, and judge how well our grow lab and its model worked.
- I can analyze data using methods like comparing numbers or looking for patterns.
- I can identify how each design solution meets the criteria and fits the constraints by examining the data.
- I can describe how the data from my model, along with the criteria and constraints, can help me improve my design through testing and making changes.
- I can use evidence and reasoning to write a scientific explanation for how environmental and genetic factors influence the growth of organisms.
Phase 5: Prove It
Warm-Up ~5 min
Do Now. Today is harvest day. Before you cut a single leaf, list the four measurements you must take, and the order you will take them in.
Why measure water use from the log BEFORE harvest day instead of guessing today?
Instruction ~10 min
Grow-lab engineers, this is the test that counts. We check every criterion and constraint with data, then compare results with what our model predicted.
| Criterion or constraint | Target | How we measure it |
|---|---|---|
| Harvest time | Greens ready to harvest within 4 weeks | Days from planting to first cut |
| Size | Fits on one shelf unit, using one outlet | Measure length and width in cm; count plugs |
| Water use | Under 2 liters a day | Refill log in mL each day |
| Cost | Under $40 | Class price list total |
| Weekends | Plants stay healthy with no watering Saturday and Sunday | Check leaves and water level Monday morning |
| Steady supply | After the first harvest, a tray of dark-green greens ready every week | Harvest log |
How to harvest and measure. 1. Record the day count since planting. 2. Measure five plants and find the average leaf height. 3. Cut leaves 2 cm above the base so the plant can regrow, and weigh the harvest in grams. 4. Add up the water log and divide by the number of days. 5. Measure the footprint and total the costs.
Worked example 1: a results table. Jamal’s team (sample data): day 27, average height 11 cm, harvest 140 g, water 9.8 L over 27 days, footprint 55 cm × 35 cm, cost $37. Water per day: 9.8 ÷ 27 ≈ 0.36 L. All four criteria met.
Worked example 2: comparing to the model. Their model predicted 0.60 cm a day and ready by day 21. Real growth was slower, about 0.47 cm a day, and they were ready by day 27. They explained: “The classroom was cooler on weekends, which our model did not include. Next time we would add a warmer spot or a thermometer to the model.” A gap between model and data is a clue for the next iteration.
| Measure | Target | Our result | Met? | Model predicted |
|---|---|---|---|---|
| Days to harvest | 28 or fewer | |||
| Average leaf height (cm) | 10 | |||
| Water per day (L) | Under 2 | |||
| Footprint (cm) | One shelf unit | |||
| Cost ($) | Under 40 | |||
| Harvest mass (g) | Record only |
Guided Exercises ~15 min
Harvest, measure, then answer these with your team’s real data.
Independent Practice ~10 min
Write up the test.
Write a scientific explanation for your harvest result. Use evidence from at least two sources (your data log, another team's data, the seed packet or the case study) to explain which environmental and genetic factors shaped your growth.
Name one limitation of your model that the harvest revealed, and describe one change you would test in version 3.
Closure ~5 min
Data in hand, grow-lab engineers. Next class we present to the cafeteria and the garden club.
Exit ticket: did your grow lab meet all four criteria? Give the number that proves each one.
How confident are you that you can I can test a design against its criteria and use the data to improve it.
Teacher notes
Materials: kitchen scale in grams, rulers, snips, colanders, the water logs, the results table, food-safe bags.
Setup: check with cafeteria staff ahead of time about their rules for school-grown produce; many cafeterias accept it with conditions, some do not. If they cannot serve it, send greens home or to a staff tasting with permission. All example numbers are sample data.
Listen for: rounding errors in water per day; teams that change their target after seeing the result.
Support / stretch: give a calculation card with the five steps. Stretch: graph all teams’ growth rates against hours of light and describe the pattern.