4.18 Testing the Model: Growth-Rate Data
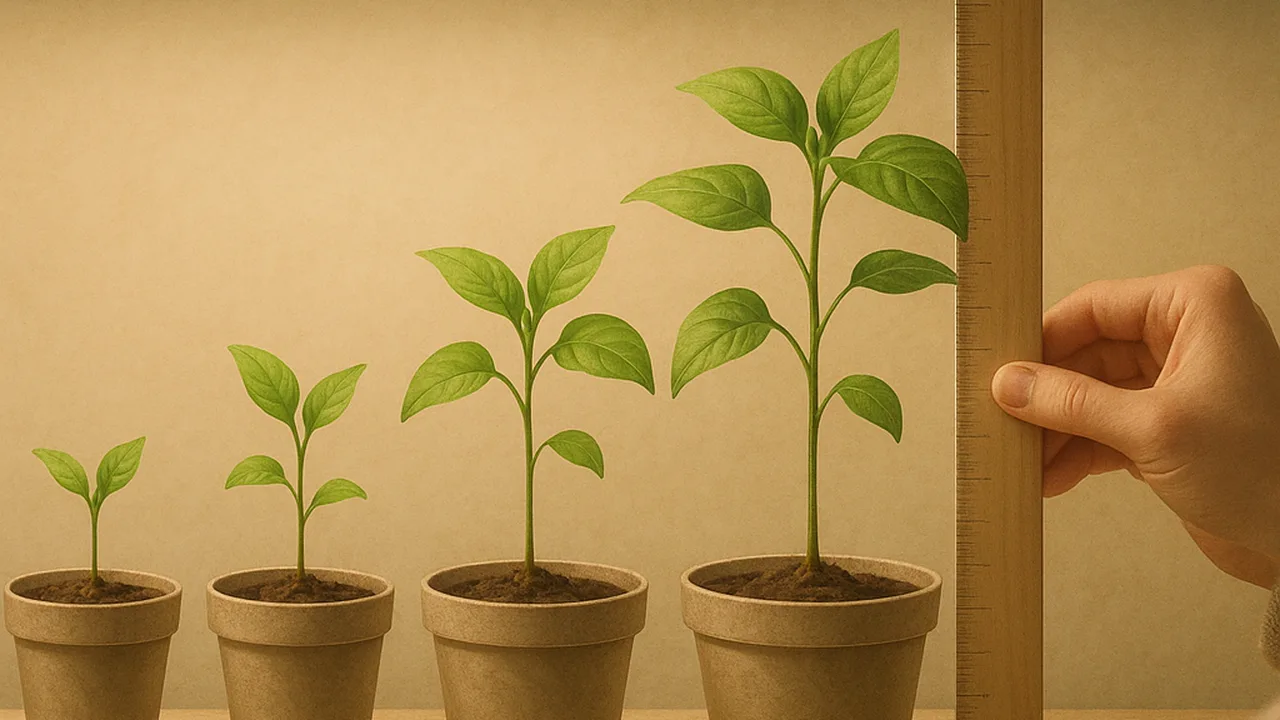
use our model to predict growth, test it with growth-rate data, and explain how light and seed type change how fast greens grow.
- I can use my model to generate data that shows how my proposed solution works and how it changes when I modify its parts.
- I can identify and describe environmental factors, such as light, water, space, and habitat size, that can influence how organisms grow.
- I can identify and describe genetic factors, such as breed or species, that can influence how organisms grow.
- I can describe how changes in environmental and genetic factors can lead to changes in the growth of organisms.
- I can use reasoning to connect evidence and explain how both environmental and genetic factors influence organism growth, and describe how these factors work together.
- I can explain that the effects of environmental and genetic factors on growth can be described using probability, since not every organism grows the same way.
Phase 4: Build
Warm-Up ~5 min
Do Now. Our phenomenon again: two seeds from the same packet, grown in different spots, end up very different sizes. Name two things about the spots that could explain it.
Two trays of the same lettuce seeds get 12 hours and 16 hours of grow light a day. Everything else is the same. What do you predict?
Instruction ~10 min
Grow-lab engineers, a model is only useful if it predicts well. Today we turn our model into numbers, then compare the prediction with data. If they disagree, we learn which part of the model or the design needs to change.
Growth rate is how much a plant grows per day. To find it, divide the change in height by the number of days: growth rate = change in height ÷ days.
Worked example 1: the 4-week question. Our client needs greens ready in 4 weeks, which is 28 days. We call lettuce “ready” when leaves reach 10 cm. Seeds sprout in about 4 days, so leaves have 24 days to grow 10 cm. 10 ÷ 24 ≈ 0.42 cm a day. So our design must give a growth rate of at least about 0.42 cm a day.
Worked example 2: reading sample data. Priya’s class grew two lettuce varieties under 12 and 16 hours of light.
| Sample data | Height on day 8 (cm) | Height on day 18 (cm) | Growth rate (cm/day) |
|---|---|---|---|
| Variety A, 12 h light | 1.5 | 5.5 | 0.40 |
| Variety A, 16 h light | 2.0 | 8.0 | 0.60 |
| Variety B, 16 h light | 2.0 | 5.0 | 0.30 |
For Variety A at 16 hours: (8.0 − 2.0) ÷ 10 days = 0.60 cm a day. That beats 0.42, so it should be ready on time. Variety A at 12 hours, 0.40, falls just short. Variety B at 16 hours grew slowest, 0.30, even with the same light. Light is an environmental factor. Variety is a genetic factor: the seed’s inherited traits set a range of how big and fast it can grow, and the environment decides where in that range it lands.
Not every plant is the same. Even in one tray, some seedlings grow faster than others. That is why we measure several plants and use the average, and why we say a factor makes faster growth more likely rather than guaranteed.
| Our grow lab | Day | Plant 1 (cm) | Plant 2 (cm) | Plant 3 (cm) | Average (cm) |
|---|---|---|---|---|---|
| Check 1 | |||||
| Check 2 | |||||
| Check 3 |
Guided Exercises ~15 min
Use the sample table, then measure three plants in your own grow lab.
Independent Practice ~10 min
Explain growth with evidence.
Write a scientific explanation: how do environmental AND genetic factors affect how fast lettuce grows? Use at least two numbers from the sample data and one from your own grow lab.
If your grow lab is too slow, which ONE part would you change first, and what does your model predict will happen?
Closure ~5 min
Your model now makes predictions you can check. Next class is our mid-build checkpoint.
Exit ticket: name one environmental factor and one genetic factor that affect plant growth, and give evidence for each.
How confident are you that you can I can use data to explain how environmental and genetic factors influence growth.
Teacher notes
Materials: rulers, the class grow labs (planted at the end of 4.16 or earlier), calculators, graph paper.
Setup: plant the hybrid grow labs as early as possible so that harvest day (4.24) falls near day 28. All numbers in the table are sample data; your seed packet’s “days to harvest” will differ. The 10 cm “ready” height is a class choice, not a rule.
Listen for: “genes decide everything” or “environment decides everything”; dividing by the wrong number of days.
Support / stretch: give a step-by-step growth-rate frame. Stretch: graph height against day for all three sample rows and explain what the steepness of each line shows.