4.13 Odds of Success: Arguing About Growth and Reproduction
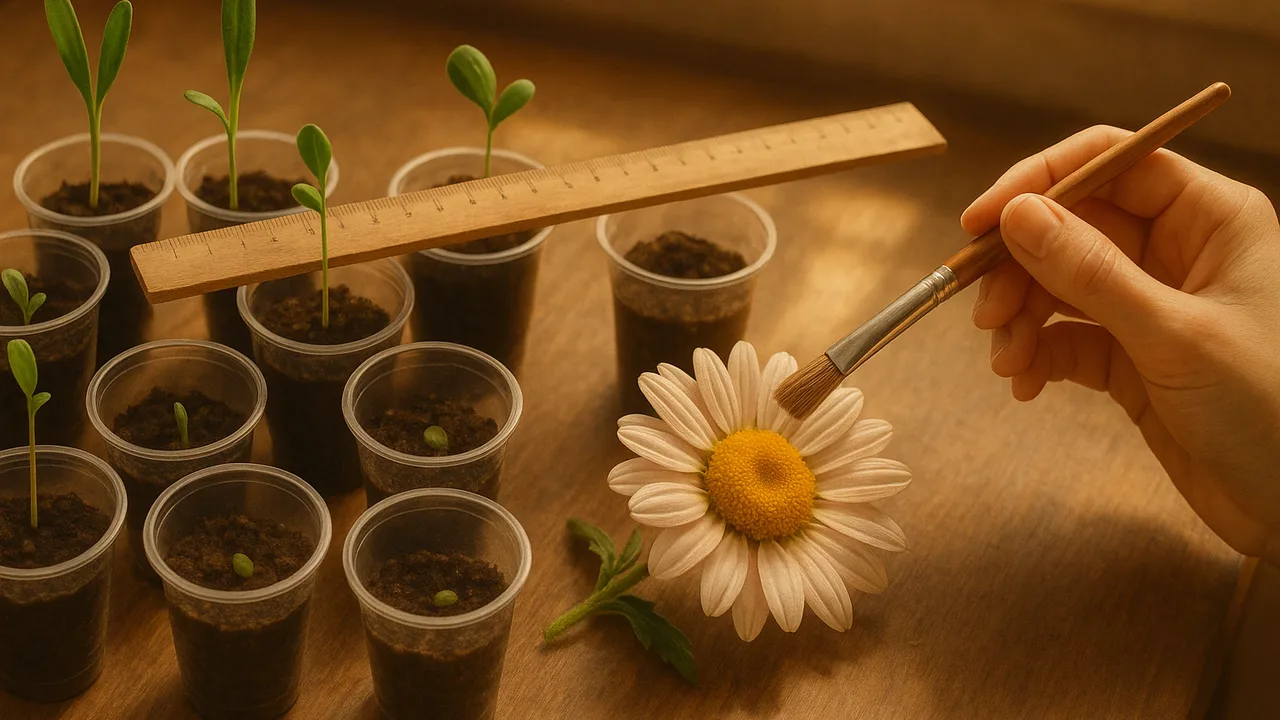
use final seedling data and pollination evidence to argue how environmental and genetic factors, structures and behaviors change the probability of growth and reproduction.
- I can use reasoning to connect evidence and explain how both environmental and genetic factors influence organism growth, and describe how these factors work together.
- I can explain that the effects of environmental and genetic factors on growth can be described using probability, since not every organism grows the same way.
- I can use evidence and reasoning to argue that many animal behaviors and plant structures affect how likely it is for animals and plants to reproduce successfully.
- I can explain that animal behaviors can sometimes help plants reproduce, like when animals spread pollen or seeds.
- I can describe how different factors work together to affect reproduction, and explain that these relationships are about increasing or decreasing the probability, not guaranteeing success.
Phase 3: Make Sense
Warm-Up ~5 min
Do Now. It has been about three weeks since 4.03. Measure your tray one last time and add the numbers to the class table.
Will EVERY seedling in the control tray be taller than EVERY seedling in the dim-light tray?
Instruction ~10 min
Final class data. Add your numbers. These rows show sample data next to blank cells for ours.
| Tray | Seeds planted | Seeds sprouted | Percent sprouted | Median height (mm) | Plants taller than 150 mm |
|---|---|---|---|---|---|
| A control (sample) | 20 | 18 | 90% | 210 | 16 of 18 |
| B dim light (sample) | 20 | 17 | 85% | 160 | 9 of 17 |
| A control (ours) | |||||
| B dim light (ours) | |||||
| C low water (ours) | |||||
| D crowded (ours) | |||||
| E dwarf / tall (ours) |
Worked example 1: talking in probabilities. In the sample data, 16 of 18 control plants passed 150 mm, which is about 89%. Only 9 of 17 dim-light plants did, which is about 53%. Jamal wrote: “Bright light raised the chance that a seedling grew past 150 mm from about half to almost nine in ten.” He did not say every plant grew tall.
Worked example 2: genes AND environment. Mei compared the tall variety under the grow light with the tall variety by the dim window. Both had “tall” genetics, but the dim-window plants were pale and thin. She concluded that genetics set what a plant can do, and the environment affects how much of that it reaches. Both factors work together.
Reproduction works the same way. A bright flower raises the chance a bee visits. A hooked burr raises the chance a seed travels. A bird’s song raises the chance of attracting a mate. None of them guarantees success, but over many plants and animals they make it more likely. Animals often help plants, too, as pollinators and seed carriers.
Sentence starters for your CER. Claim: “___ and ___ both affected how our peas grew.” Evidence: “___ of ___ plants in tray ___ grew past ___ mm, compared with ___ of ___ in tray ___.” Reasoning: “This shows that ___ raises the probability of ___, because ___.”
Guided Exercises ~15 min
Use the class table and your notes from 4.03 and 4.06.
Independent Practice ~10 min
Write your growth argument for the grow lab care plan.
Write a CER: How do environmental and genetic factors affect the growth of our peas? Use at least two numbers from the class table and one other reliable source. Use the word probability or chance in your reasoning.
In two sentences, argue how ONE plant structure and ONE animal behavior from 4.06 raise the chance of reproduction. Rate how strong your evidence is and say why.
How confident are you that you can I can argue about growth and reproduction using data and probability.
Closure ~5 min
We now know which conditions give our greens the best odds. Next time we turn everything we learned into ideas for the grow lab and the exhibit.
Exit ticket: which ONE condition from our data would you change first in the grow lab to raise the chance of a good harvest? Give your evidence.
Teacher notes
Materials: the seedling trays from 4.03, rulers, the class data table projected, calculators, CER organizers.
Setup: collect final measurements in the first 8 minutes. If trays failed, use the sample rows, which are made up for teaching.
Listen for: “always” and “never” claims, and “genes decide everything.” Steer toward “raises the chance.” No genetic mechanisms (assessment boundary); “inherited trait” is enough.
Support / stretch: give a percent calculation strip. Stretch: compare the spread (shortest to tallest) between trays and explain what a large spread means.