4.03 Seedling Showdown: Light, Water, Space and Seed Type
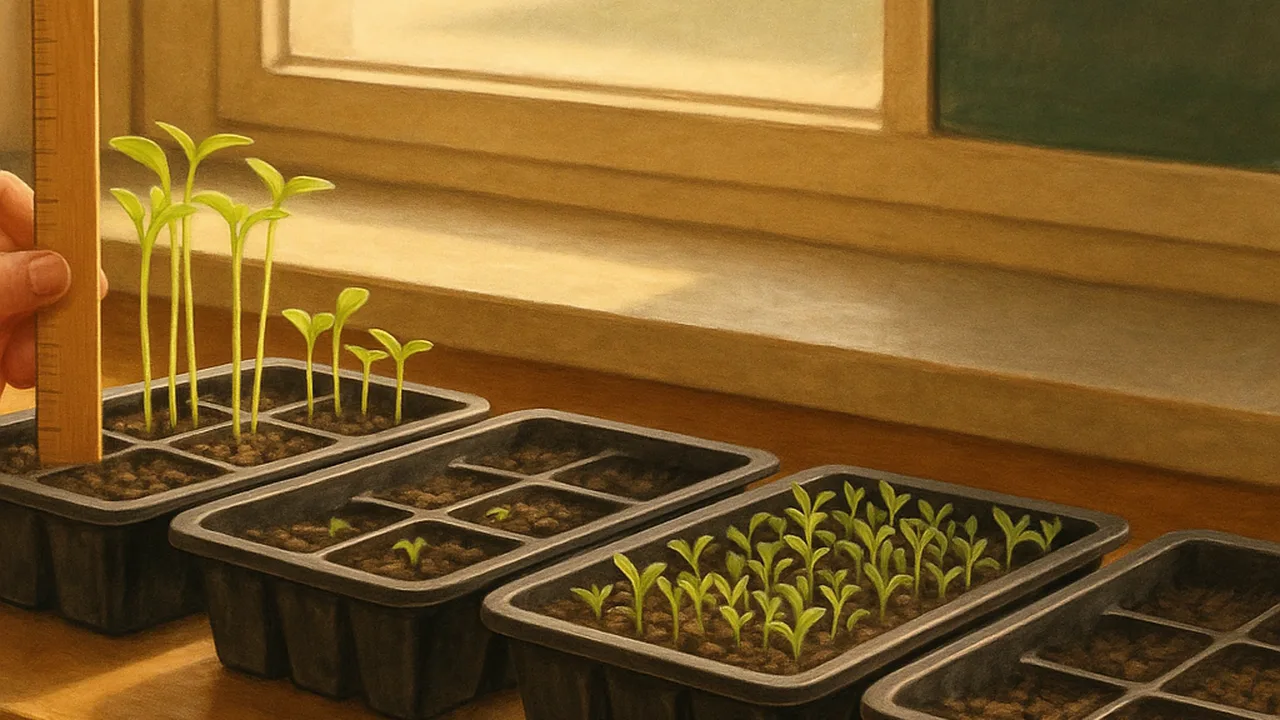
collect and compare growth data from seedlings grown with different light, water and spacing and from two seed varieties, and define the grow lab’s criteria and constraints.
- I can identify and describe environmental factors, such as light, water, space, and habitat size, that can influence how organisms grow.
- I can identify and describe genetic factors, such as breed or species, that can influence how organisms grow.
- I can describe how changes in environmental and genetic factors can lead to changes in the growth of organisms.
- I can use evidence from multiple reliable sources, like investigations, observations, reading, or data, to build my scientific explanation.
Phase 2: Investigate
Warm-Up ~5 min
Do Now. Ten days ago we planted pea seeds in five trays. Walk past the trays without touching them. Write down the two biggest differences you notice.
Tray E holds a dwarf pea variety and a tall pea variety, side by side, with the same light, water and space. What will we find?
Instruction ~10 min
Explore first. Each team measures one tray. Use a ruler to measure the height of every seedling in millimeters, from the soil to the top of the stem. Count the true leaves. Note the color: dark green, pale green or yellow. Then share your numbers on the class table.
| Tray | What was different | Number of seedlings | Median height (mm) | Shortest–tallest (mm) | Average leaves per plant | Color |
|---|---|---|---|---|---|---|
| A (control) | Grow light, normal water, 1 seed per cell | |||||
| B | Dim window light only | |||||
| C | One-quarter of the normal water | |||||
| D | Crowded: 5 seeds per cell | |||||
| E (dwarf) | Dwarf variety, control care | |||||
| E (tall) | Tall variety, control care |
Worked example 1: reading a fair comparison. Trays A and B are the same in every way except light. So a difference between A and B points to light as the cause. Trays A and E (tall) are the same in every way except the seed variety. Jamal compared A with D and said “crowding,” because spacing is the only change between those two trays.
Worked example 2: why use the median? These numbers are sample data. Ava’s tray B heights were 62, 70, 71, 75 and 140 mm. One seedling was tall and pale because it stretched toward the window. The median is 71 mm, the middle value. The mean is about 84 mm, pulled up by one odd plant. The median describes a typical seedling better here.
Naming the ideas. Light, water, space and fertilizer are environmental factors: conditions around the organism. The seed variety is a genetic factor: traits passed down from the parent plants. Both kinds of factors affect how big an organism grows.
Defining our grow lab problem. The data help us write criteria, the goals our lab must meet. Sample criteria: produce at least one tray of greens ready to harvest every week; keep plants dark green, not pale. The constraints are our limits: one shelf unit, one outlet, a small budget, and no watering on weekends.
Guided Exercises ~15 min
Use the class data table as evidence for every answer.
Independent Practice ~10 min
Turn the class data into a graph and a decision.
Make a bar graph of median height for all six rows. Then write one sentence about an environmental factor and one about the genetic factor, each backed by a number from the graph.
How confident are you that you can I can use growth data to describe environmental and genetic factors.
Closure ~5 min
Light, water, space and seed type all changed how our peas grew. We keep measuring these trays all unit. Next time we look for the matter a plant takes in and gives off, using a color-changing clue.
Exit ticket: write one criterion and one constraint for the grow lab. Explain which seedling data support your criterion.
Teacher notes
Materials: five seed trays or egg cartons with potting mix, pea seeds of one dwarf variety and one tall (vining) variety, an LED grow light or bright shop light on a timer, a measuring cup, rulers with millimeters. Pea shoots are also a salad green, so the trays double as a harvest.
Setup: plant 10–14 days before this lesson. Tray A: grow light, normal water, 1 seed per cell. B: dim spot, same water. C: one-quarter water. D: 5 seeds per cell. E: both varieties under control care. Keep trays going; 4.13 uses the later data. If trays fail, use the sample numbers in the lesson.
Listen for: “taller always means healthier” and “the tall variety had better care.” Point back to the fair comparison. Keep genetic factors at the level of inherited traits; no genes or DNA mechanisms (assessment boundary).
Support / stretch: give a partly filled table and a graph template. Stretch: calculate the percent of seeds that sprouted in each tray.