2.18 Punnett Squares for the Plan: Predicting Each Generation
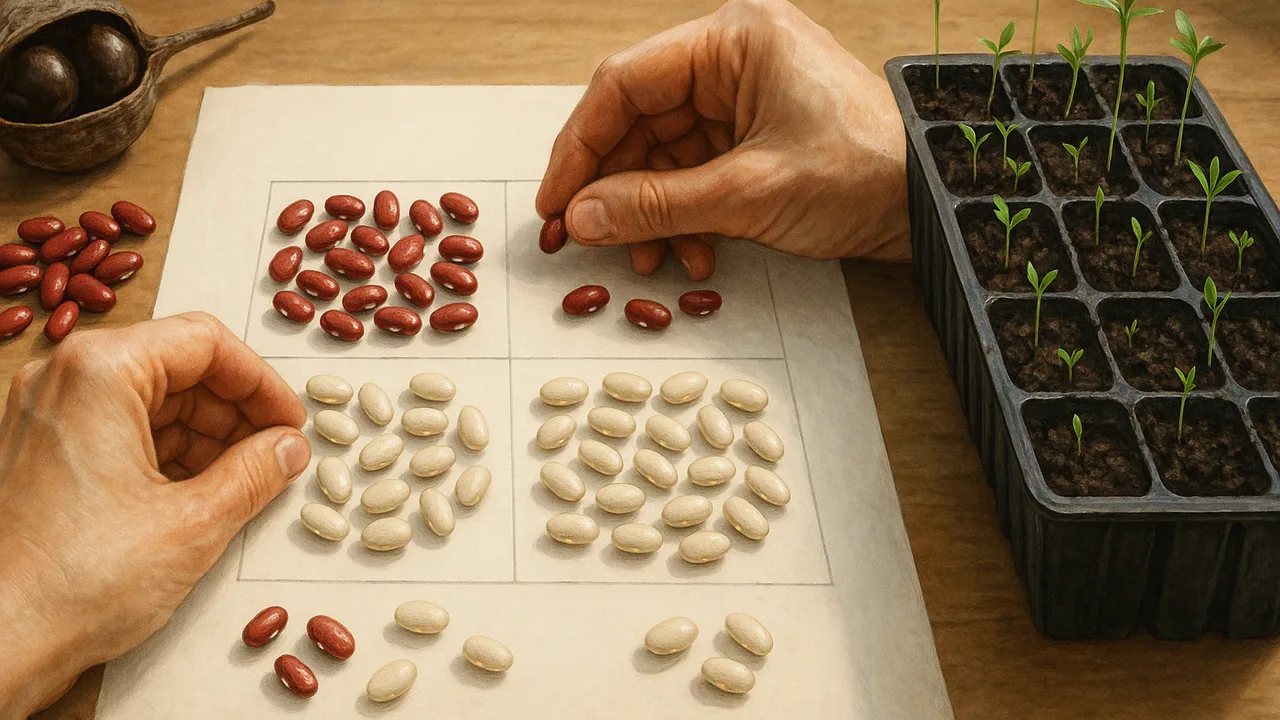
use Punnett squares to predict the offspring of each cross in our plan, and compare the variation that sexual and asexual reproduction produce.
- I can develop a model, like a Punnett square or diagram, to show the differences in chromosome pairs and genetic variants between asexual and sexual reproduction.
- I can identify and describe the chromosomes and genetic variants in both parents and offspring for asexual reproduction in my model.
- I can identify and describe the chromosomes and genetic variants in both parents and offspring for sexual reproduction in my model.
- I can use my model to explain that asexual reproduction creates offspring with chromosomes identical to the single parent.
- I can use my model to explain that sexual reproduction creates offspring with chromosomes that are a mix of genetic material from two parents, resulting in new gene combinations and genetic variation.
- I can use my model to predict that organisms reproducing sexually have more genetic variation in their offspring than organisms reproducing asexually.
Phase 4: Build
Warm-Up ~5 min
Do Now. A gardener grows new potato plants by planting pieces of one potato. Another grows beans from seeds made by flowers. Whose new plants will be more alike? Explain in one sentence.
How many parents give genes to a plant grown from a potato piece?
Instruction ~10 min
Breeders, we can predict our crosses before we plant them. In our model, drought tolerance comes from one gene with two variants, which you called alleles in 2.05: D (tolerant, dominant) and d (not tolerant, recessive). DD and Dd plants are tolerant; only dd plants are not. This is a simplified model; in real beans, drought tolerance usually depends on several genes.
Sexual vs asexual reproduction. In sexual reproduction, each parent gives one chromosome from each pair, so the offspring has the same number of chromosomes as each parent, half from each. That shuffles variants into new combinations and creates variation. Bean flowers usually pollinate themselves, so breeders cross two varieties by moving pollen by hand. In asexual reproduction, such as potatoes grown from pieces or strawberry runners, one parent’s chromosomes are copied, so offspring are genetically identical clones.
Worked example 1: the first cross. Plan B crosses the donor (DD) with an heirloom (dd). Every box in the Punnett square is Dd, so 100% of generation 1 is tolerant. In a dry year, 80% survive.
| Donor DD × heirloom dd | d | d |
|---|---|---|
| D | Dd | Dd |
| D | Dd | Dd |
Worked example 2: explaining the dip. The farm saves seed from generation 1, so generation 2 comes from Dd × Dd. The square shows 1 DD : 2 Dd : 1 dd, so 3 of 4 plants (75%) are tolerant. Dry-year survival = 0.75 × 0.8 + 0.25 × 0.3 = 0.60 + 0.075 = 0.675, about 68%. The recessive d variant was hiding in generation 1 and shows up again.
| Saved seed: Dd × Dd | D | d |
|---|---|---|
| D | DD | Dd |
| d | Dd | dd |
A warning from history. In the 1840s, a plant disease destroyed potato crops across Ireland. Many fields grew only a few varieties planted from pieces of potato, so the plants were nearly identical and shared the same weakness. Low variation can leave a whole crop at risk.
Guided Exercises ~15 min
Draw each Punnett square in your notebook before you answer.
Independent Practice ~10 min
Apply it to the farm.
The farm asks: “Why not just grow our beans from cuttings so every plant is a copy of the best one?” Use what you know about asexual reproduction and variation to answer, and connect your answer to our diversity criterion.
Use the Dd × Dd Punnett square to explain to the farm why Plan B's survival dips in generation 2.
Closure ~5 min
Punnett squares turn our plan into predictions. Next class you will combine the best features of all three plans.
Exit ticket: predict which group has more genetic variation, 100 bean plants from seeds or 100 potato plants from pieces of one potato, and explain why.
How confident are you that you can I can use a Punnett square to predict offspring and compare sexual and asexual reproduction.
Teacher notes
Materials: Punnett square templates; optional: two cups of colored beads (one D color, one d color) to pull a variant from each parent cup; a sprouting potato or spider plant to show.
Setup: stress that the one-gene drought model is a classroom simplification. If Part 1 used different letters for the variants, use the class letters.
Listen for: “dominant means more common” (dominant only means it shows with one copy); “offspring get all of both parents’ chromosomes.”
Support / stretch: give pre-filled parent letters on the square. Stretch: predict the tolerant percentage if a Dd plant is crossed back to the DD donor.