2.07 The Bead Predator Game: Selection Across Generations
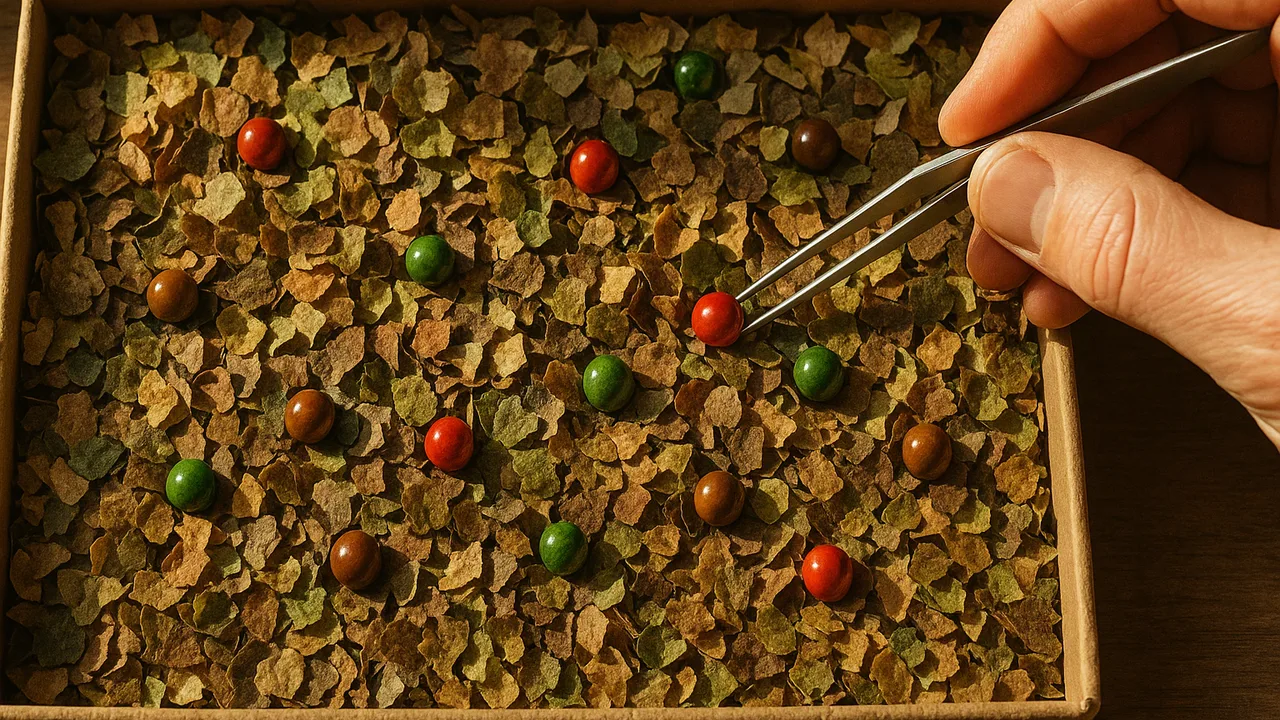
simulate predators hunting a varied population and use proportions over generations to explain how a helpful trait becomes more common.
- I can explain that populations have a variety of inheritable genetic traits, and that these variations come from genetic differences.
- I can describe how some traits give organisms advantages in certain environments, making it more likely they will survive and reproduce.
- I can use reasoning to show how natural selection causes the proportion of advantageous traits to increase and disadvantageous traits to decrease in a population over generations.
- I can identify population changes, such as trends or averages, using data from graphs, charts, or simulations.
- I can find information about how specific traits are distributed in a population over time using data or simulations.
- I can identify changes in environmental conditions, like climate or resources, over time using data or simulations.
- I can use data and proportional reasoning to support the explanation that traits helping survival and reproduction become more common in a population, while less helpful traits become less common.
- I can explain that sometimes populations cannot adapt quickly enough to survive because natural selection takes place over many generations.
Phase 2: Investigate
Warm-Up ~5 min
Do Now. A sheet of green fabric holds 20 green beads and 20 brown beads, which stand for beetles. A “bird” with tweezers grabs beads for 15 seconds. Predict which color will be grabbed more.
On green fabric, which beetles will the bird catch more often?
Instruction ~10 min
Explore first. Rules: start with 20 green and 20 brown beads spread on green fabric. The bird picks one bead at a time with tweezers and stops at 20 beads eaten. Count the survivors. Each survivor reproduces: add one new bead of the same color, so the population returns to 40. Repeat for four generations, rotating who plays the bird.
| Generation | Green at start | Brown at start | Green eaten | Brown eaten | % green at start | % brown at start |
|---|---|---|---|---|---|---|
| 1 | 20 | 20 | 50% | 50% | ||
| 2 | ||||||
| 3 | ||||||
| 4 | ||||||
| 5 |
Graph % green at the start of each generation as a line graph, with generation on the x-axis.
Name the ideas. This is natural selection. Individuals vary in inherited traits. In a given environment, some traits raise the chance of surviving and reproducing. Those individuals leave more offspring, so the helpful trait’s proportion grows over generations. A trait that helps in an environment is called an advantage, and when it spreads this way it becomes an adaptation.
Worked example 1: the numbers. Sample data from Arjun’s team. Generation 1: the bird ate 6 green and 14 brown. Survivors: 14 green and 6 brown. Doubling gives 28 green and 12 brown, so generation 2 starts 28 ÷ 40 = 70% green. Next round the bird ate 11 green and 9 brown, leaving 17 green and 3 brown, so generation 3 starts 34 green and 6 brown: 85% green.
Worked example 2: probability of surviving. In generation 1, 14 of 20 green beads survived, a 70% chance. Only 6 of 20 brown beads survived, a 30% chance. No single green bead was safe; green beads simply had better odds. Over many generations, better odds add up to a big change in the population.
What did NOT happen. No bead changed color. The population changed because of who survived and reproduced.
Guided Exercises ~15 min
Use your team’s table and line graph.
Independent Practice ~10 min
Explain your graph.
Describe the trend in your line graph using at least three numbers from your table. Then explain the cause of the trend in three steps: variation, advantage, more offspring.
Connect the game to the farm: in a drought, what plays the role of the bird, and what plays the role of camouflage?
Closure ~5 min
Nature selected the beads without anyone choosing. Next time, we see what happens when people do the choosing.
Exit ticket: use your data to explain why the proportion of green beetles rose over the generations. Include at least one percent.
Teacher notes
Materials (per team): a sheet of green fabric or felt, about 60 green and 60 brown pony beads or dried peas and beans of two colors, tweezers or clothespins, a timer, graph paper.
Setup: keep extra beads in team cups for the reproduce step. Keep the fabric for 2.12, when the environment changes to brown.
Listen for: “they adapted” used to mean individuals changed, and “the strongest survive.” Fitness means leaving offspring, not strength. Stay inside the boundary: proportions and simple probability only, no Hardy–Weinberg.
Support / stretch: give a percent table with the totals filled in. Stretch: predict how many generations it would take for brown to disappear and explain why it might never reach exactly zero.