1.02 The Valley as a System
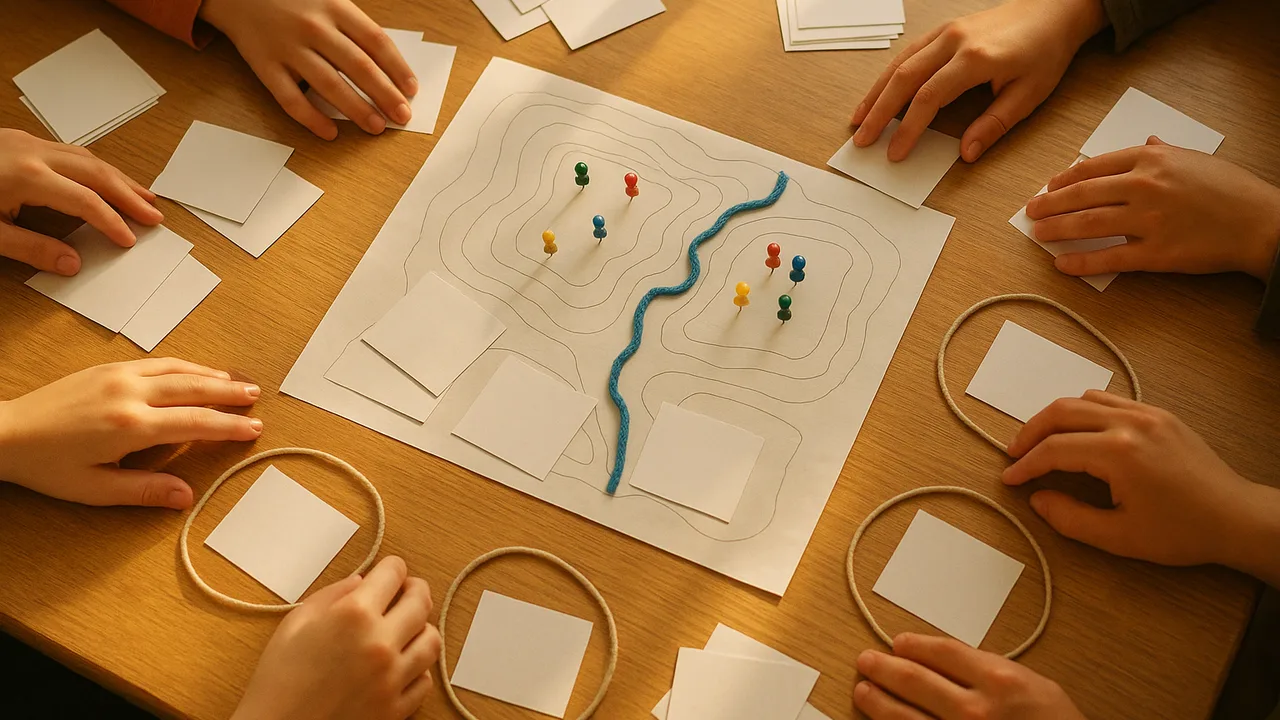
The Hazard-Ready River Town
How can reading Earth’s past help a town find its resources, forecast its hazards, and protect people from fast-moving debris?
The mystery: After days of heavy rain, a hillside above a river town gives way. Mud and boulders race downhill fast enough to knock over walls. In the road cut nearby, layers of rock hold seashells, coal and volcanic ash.
map the river valley as a system and organize the hazard information the planning board gave us by type, location and warning signs.
- I can identify the system where the problem exists, including its main parts, how they relate, and what is inside or outside the system.
- I can explain who needs the problem solved, what needs must be met, and which scientific issues are important.
- I can analyze how possible solutions might affect people and the environment, and decide which issues and parts of the system matter most.
- I can organize data about natural hazards by type, location, magnitude, frequency, and any warning signs or geologic forces involved.
Phase 1: Spark
Warm-Up ~5 min
Do Now. Remember from grade 6 that Earth’s systems include the geosphere, hydrosphere, atmosphere and biosphere. List one part of the river valley that belongs to each.
If loggers clear the trees from the steep hillside, what happens to the landslide risk?
Instruction ~10 min
Explore first: the board’s file. Each team gets a folder of cards from the planning board: a river gauge report, a slope map, notes from an old newspaper, a rain record and a list of past events. Sort the events into the table before we name anything.
| Event card | Hazard type | Where in the valley | How big (small, medium, large) | Warning signs before it |
|---|---|---|---|---|
| A | ||||
| B | ||||
| C | ||||
| D | ||||
| E | ||||
| F |
Name the ideas. A system is a set of parts that interact. Our valley system includes the hillside, its soil and trees, the gully that channels water, the river, the town and its people. The boundary decides what is inside our problem. Rain clouds start outside the boundary, but the rain they drop flows in.
Worked example 1: drawing the system. Jamal drew boxes for Hillside, Gully, River, Homes and Road, with arrows for rainwater, soil and debris. He circled the gully above Mill Road as the place a barrier could go. He wrote “outside the boundary: the weather itself”, because no design can stop the rain.
Worked example 2: organizing hazard data. Mei sorted six event cards by type first: three floods, two landslides, one debris flow. Then she sorted by location and noticed every slide happened on the steep east slope. Organizing data by type, place, size and warning signs makes patterns easier to see.
Team roles. Each team rotates four roles weekly: Lead Geologist (keeps the team on the question), Data Analyst (tables and graphs), Materials Manager (gathers, checks and returns equipment) and Reporter (shares findings and questions with the class).
Guided Exercises ~15 min
Use your sorted event cards and your team’s system drawing.
Independent Practice ~10 min
Draw and explain the valley system in your notebook.
Draw the valley as a system with at least five parts and arrows for water, soil and debris. Mark the boundary and label one thing outside it.
Pick one part of the system. Explain how changing it, such as paving a hilltop or planting trees, could change the hazard below.
Closure ~5 min
We know our system and our teams. Next phase, we investigate: first the rock layers in the road cut.
How confident are you that you can I can describe the valley as a system and sort hazard data by type, place, size and warning signs.
Exit ticket: which part of the valley system matters most for the barrier problem, and why?
Teacher notes
Materials: board folders with six generic event cards (A: spring flood covers the park; B: small slide on east slope after a wet week; C: debris flow crosses Mill Road after heavy storm; D: minor flood after snowmelt; E: rockfall on east-slope road cut; F: large flood after several days of rain). All events are fictional sample records. Role cards for four roles.
Listen for: systems drawn as lists with no arrows; students putting the weather inside the design boundary.
Support / stretch: give a partly drawn valley outline. Stretch: add a feedback arrow, such as how a slide can dam the river and cause a flood.