2.12 Reading the Generations: When the Environment Changes
analyze graphs of trait proportions over generations to explain how a change in the environment changes which traits become common.
- I can use graphs, charts, or other data to find patterns and trends in how traits are distributed in a population over time.
- I can identify cause-and-effect relationships between changes in the environment and changes in traits in a population.
- I can explain that increases or decreases in certain traits can have more than one environmental cause.
- I can analyze data to show that the distribution of traits in a population changes over time when the environment changes, and explain how this is evidence of adaptation by natural selection.
- I can describe that because there are many different causes affecting natural selection, we cannot predict exactly what will happen to a population.
Phase 3: Make Sense
Warm-Up ~5 min
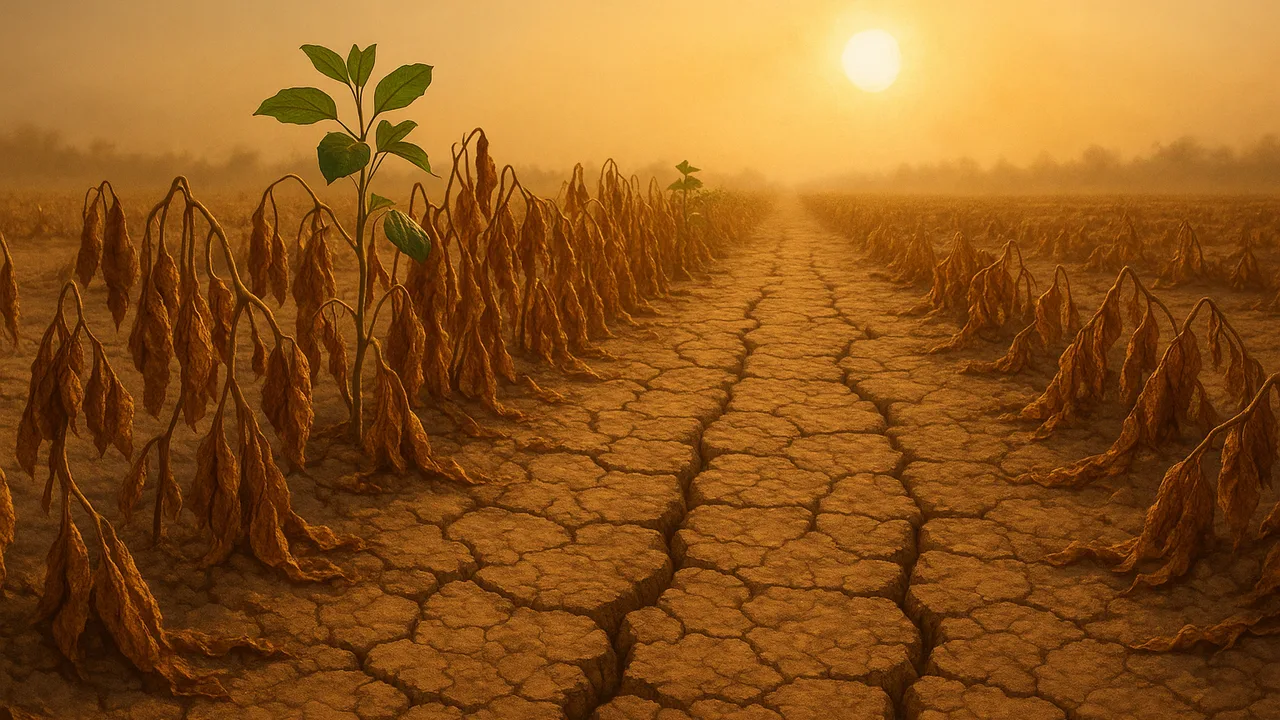
Do Now. A long drought turns the green meadow brown. Your bead population from 2.07 is now 95% green. Predict the next four generations.
After the meadow turns brown, the percent of green beetles will most likely…
Instruction ~10 min
Run it again. Start the bead game with your 2.07 survivors, but spread them on brown fabric. Play four generations and record the percents.
| Generation on brown fabric | Green at start | Brown at start | % green | % brown |
|---|---|---|---|---|
| 1 | ||||
| 2 | ||||
| 3 | ||||
| 4 |
Reading: populations track their environment. When the environment changes, the traits that are an advantage can change too. Traits that now help survival and reproduction become more common; traits that no longer help become less common. This takes many generations. If the environment changes faster than the population can adapt, or if no individuals have a helpful variation, the population may shrink or even die out. Many causes act at once, such as predators, food, temperature and disease, so scientists can describe likely trends but cannot predict exactly what will happen.
Worked example 1: reading a flip. Sample data: on green fabric, Diego’s team went 50%, 70%, 85%, 95% green. On brown fabric, the next generations read 95%, 80%, 60%, 40% green. The line rose, peaked, then fell. The cause of the turn was the change in the environment, not a change in any bead.
Worked example 2: a beak-tool data set. Sample data from a “bird beak” game: birds with tweezer beaks and birds with spoon beaks gather seeds. In a wet year with many small seeds, tweezer beaks are 60% of the next generation. After a dry year leaves mostly large, hard seeds, spoon beaks rise to 65%. Two different environments favored two different traits.
Guided Exercises ~15 min
First explore the simulation, then answer the cards.
Independent Practice ~10 min
Graph and explain.
Make one line graph of % green across all generations, green fabric then brown. Mark when the environment changed. Write a CER: claim about what caused the change, evidence with at least three percents, and reasoning about survival and reproduction.
Name two other environmental changes, besides background color, that could shift which beetles survive. Explain why this means we cannot predict the exact future of a population.
Closure ~5 min
Populations follow their environment, slowly and not always in time. Next time, we use all of this to explain the bean field’s drought story.
Exit ticket: use data to explain how a change in the environment changed the distribution of a trait in a population over generations.
Teacher notes
Materials: the 2.07 bead populations, brown fabric or paper grocery bags, tweezers, devices for the PhET Natural Selection sim (HTML5 version, checked to load), graph paper.
Setup: if devices are limited, project the sim and let teams call the settings. The beak-game data are sample data; you can run it live with tweezers, spoons, small seeds and large dried beans.
Listen for: “the beetles changed color because they needed to.” Individuals do not change; proportions do. Stay inside the boundary: percents and proportions only, no Hardy–Weinberg. Some students may have questions about evolution and their beliefs; answer respectfully with the evidence.
Support / stretch: give a partly drawn graph with the environment change marked. Stretch: in the sim, find a setting that makes the population die out, and explain why.