1.08 Debris Flow on a Ramp: Modeling the Slide
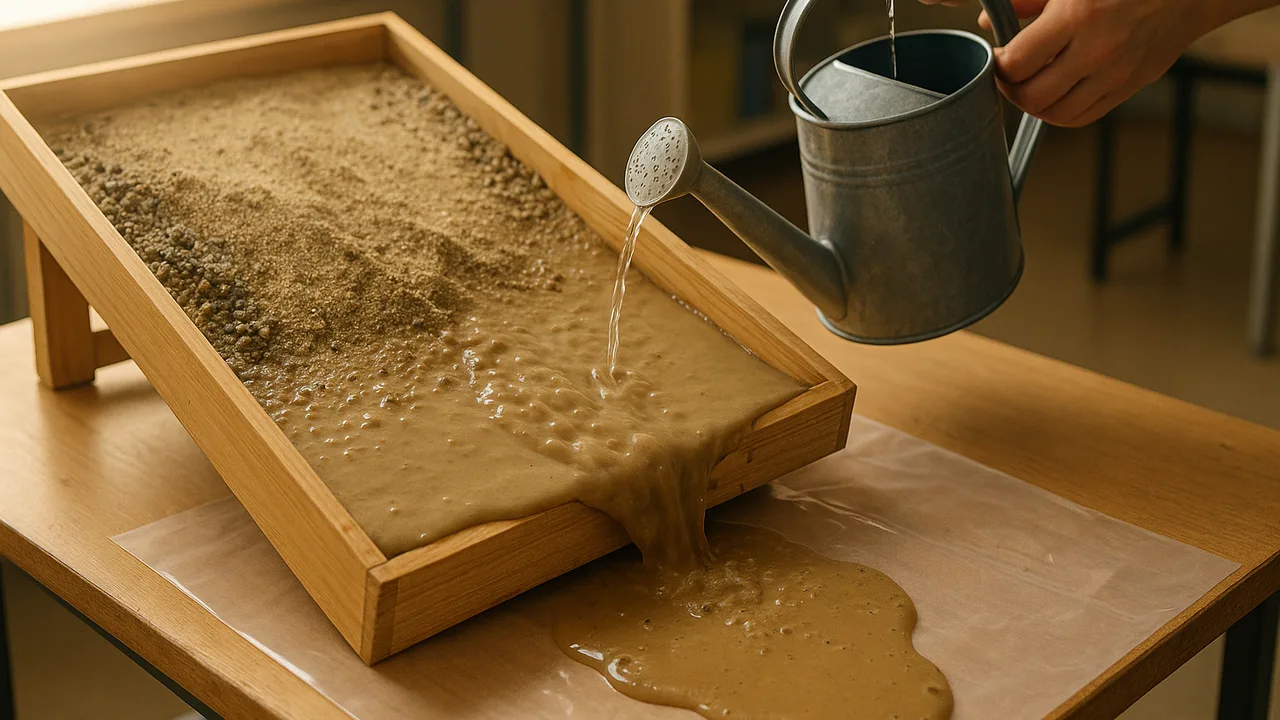
model a debris flow on a ramp and analyze how slope and water change how far and how hard the flow travels.
- I can describe that kinetic energy and mass have a linear relationship, so doubling the mass doubles the kinetic energy and halving the mass halves the kinetic energy.
- I can describe that kinetic energy and speed have a nonlinear (square) relationship, so doubling the speed makes the kinetic energy four times greater and cutting the speed in half makes the kinetic energy four times smaller.
- I can analyze data to find patterns in where natural hazards happen compared to geographic or geologic features.
- I can analyze data to find patterns in how often and how severe natural hazards are, and what types of damage they cause.
- I can analyze data to find patterns in the timing or location of events that happen with natural hazards, like aftershocks or flash floods.
Phase 2: Investigate
Warm-Up ~5 min
Do Now. Watch your teacher pour a spoonful of dry sand down a tilted tray, then a spoonful of soupy wet sand. Write one difference you see in how each moves.
On a steeper ramp, what happens to a debris flow at the bottom?
Instruction ~10 min
Explore first: the gully model. A 1 m ramp with side walls stands for the gully above Mill Road. A paper cup “house” sits 20 cm past the bottom. Load a cup with a standard debris mix: 10 marbles plus a scoop of sand. Change one variable at a time: ramp height (10, 20 or 30 cm) and mix (dry or wet). For each run, measure runout distance and how far the house cup slides.
| Run | Ramp height (cm) | Mix (dry or wet) | Runout distance (cm) | House slide (cm) | Marbles that reached the house |
|---|---|---|---|---|---|
| 1 | |||||
| 2 | |||||
| 3 | |||||
| 4 | |||||
| 5 | |||||
| 6 |
Name the ideas. A debris flow is a fast slurry of water, mud, rocks and wood. Water lets grains slip past each other, so a wet mix flows farther than a dry pile. Steep, narrow gullies speed flows up. A flow’s punch depends on its mass and speed, just like the rolling balls in 1.07. Engineers use this to design mitigation: barriers, nets and catch basins that slow or trap debris before it reaches homes.
Worked example 1: slope (sample data). With the wet mix, runout was 25 cm from a 10 cm ramp height and 60 cm from 30 cm. Only the high-ramp flow reached the house, sliding it 8 cm. Steeper slope, faster flow, more energy.
Worked example 2: water (sample data). At 20 cm ramp height, the dry mix stopped at 15 cm while the wet mix ran 45 cm. Priya linked this to 1.06: big storms soak the slope, so the real gully’s flows are wet flows, the farthest-running kind.
Worked example 3: a first look at stopping it. Jamal placed a small comb of craft sticks across the ramp’s foot. Marbles stopped behind it, but muddy water passed between the sticks. He noted, “Catch the big pieces, let the water through.” Real debris barriers often use the same idea.
Guided Exercises ~15 min
Use your run data. Agree as a team before answering.
Independent Practice ~10 min
Connect the model to the real valley.
Describe one way our ramp is like the real gully and one way it is not. How could the difference affect our conclusions?
Using your data, explain where in the gully a barrier would face the least energy, near the top or near the bottom, and why.
Closure ~5 min
We know how debris flows gain their punch. Next time, we write the exact criteria and constraints for our barrier.
Exit ticket: which variable, slope or water, changed runout more in your data? Give the numbers.
Teacher notes
Materials (per team): 1 m ramp with side walls (rain gutter or folded cardboard), books for height, 10 marbles, sand, a cup of water, a shallow tray at the ramp’s foot to catch everything, paper cups, meter stick, craft sticks, goggles, paper towels.
Setup: line the end zone with a tray so the slurry stays contained. The 1 m ramp and 10 marbles match the class criteria set in 1.09 and the barrier test in part 2.
Listen for: “heavier always means faster” (on a ramp, speed depends mostly on height and friction). Keep energy talk to ratios.
Support / stretch: assign one variable per team and pool class data. Stretch: add a bend or a narrowing to the ramp and test its effect.