1.15 Mapping the Valley: A Town Hazard and Resource Map From Data
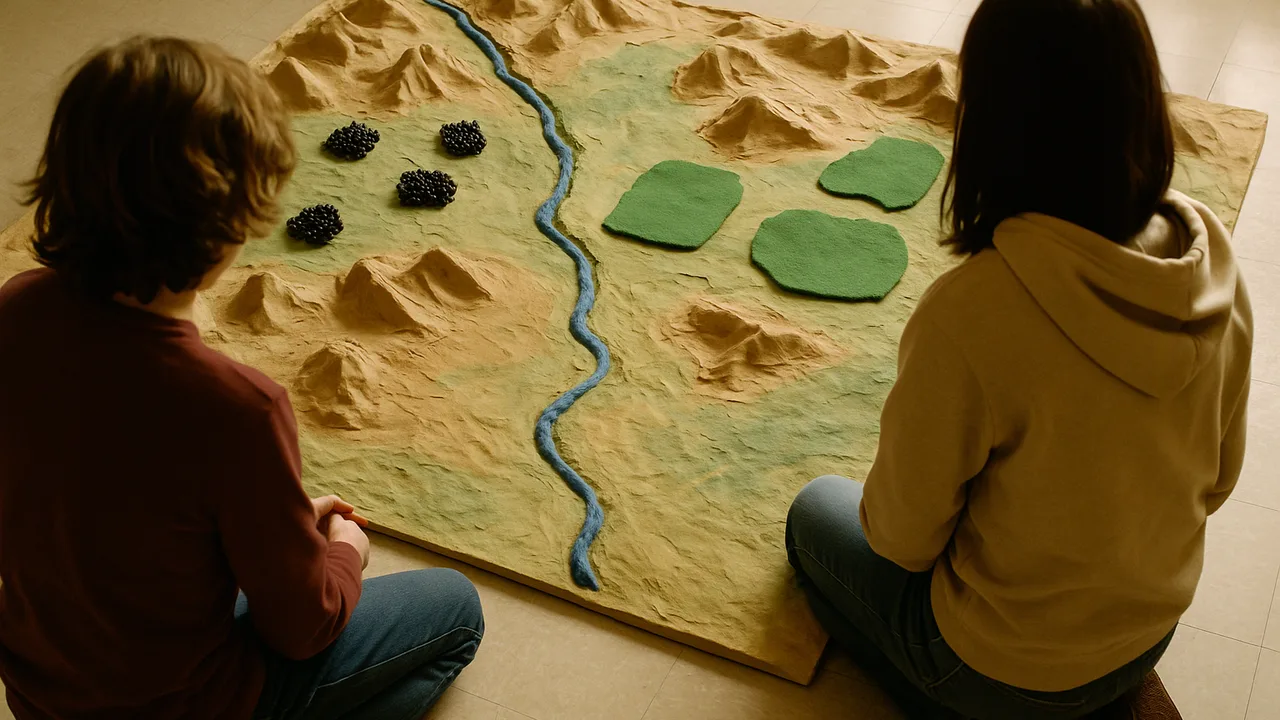
build a hazard and resource map of the river town from data and explain why its coal, groundwater and hazards sit where they do.
- I can use reasoning to connect evidence and explain how Earth’s resources are formed by geologic processes.
- I can describe why resources are found only in certain places or times, based on the specific environments or conditions that formed them.
- I can explain how resources are depleted as they are used and how they can be replenished, mainly through geologic processes.
- I can use data to describe which areas are most and least at risk for natural hazards.
- I can use data to explain how often different areas are at risk for natural hazards.
- I can use data to describe what kinds of damage each area might face during a natural hazard event.
- I can explain that newer rock layers are usually found on top of older layers unless something has disturbed them.
- I can describe how features like faults or igneous intrusions are younger than the rocks they cut through.
- I can use the fossil record to compare the ages of rock layers based on which organisms are found in them.
Phase 4: Build
Warm-Up ~5 min
Do Now. Picture the river town from our phenomenon. Where would you NOT build a new school: at the mouth of a steep gully, on the floodplain, or on a gentle terrace above the river? Write one reason for each place.
The planning board wants one map before it spends any money. Which map helps it most?
Instruction ~10 min
Engineers, welcome to the Build phase. In Make Sense you explained the road cut, the town’s resources and its landslide and flood history. Now you turn that science into tools for our client, the town planning board. Tool one is a hazard and resource map built only from data.
Read the road cut again. From bottom to top, the sample road cut shows: shale with seashell fossils, sandstone, a coal seam, a thin volcanic ash layer, then more sandstone. Newer layers sit on top of older ones unless something disturbed them. A small fault breaks the shale and the coal but not the top sandstone, so the fault is younger than the layers it cuts and older than the layer above it. The seashells show a shallow sea covered this place long ago. The coal shows a swampy forest came later. The ash records an eruption somewhere upwind. Scientists group events like these into the geologic time scale, which spans Earth’s 4.6-billion-year history.
Why resources are uneven. Coal forms only where swamp plants were buried and squeezed for millions of years, so it is found only in certain layers. Groundwater collects in porous layers, such as river gravel and sandstone, that sit below the water table. Limestone and shale record old seas. These resources took far longer to form than people take to use them, so they are limited and mostly nonrenewable.
Worked example 1: a resource dot. Ava’s team reads sample well data. Wells on the valley floor reach water at 6 m; wells on the ridge hit dry rock at 40 m. She marks the aquifer under the floodplain and writes: “Groundwater is here because the river laid down porous gravel.”
Worked example 2: a hazard zone. Jamal’s team reads the sample event log: 5 debris flows in 30 years, all from the east gully, and 3 floods, all on the low floodplain. He shades the gully fan red and the floodplain blue, and labels the terrace “lowest risk.” Every color on the map points back to a row of data.
| Map zone | Hazard or resource | Evidence row (sample data) | Past process that explains it | Risk: high, medium, low |
|---|---|---|---|---|
| East gully fan (above Mill Road) | ||||
| Floodplain | ||||
| River terrace | ||||
| Coal ridge | ||||
| Valley aquifer |
Guided Exercises ~15 min
Use the sample event log and well data. Add each answer to your map table.
Independent Practice ~10 min
Finish your team’s map.
Complete the map table. For each zone, cite one row of sample data and name the past process (sea, swamp, river or eruption) behind it.
Write a three-sentence explanation for the board: why does the town have coal and groundwater in some places but not others?
Closure ~5 min
Your map shows the board where the danger is. Next class, you will sketch three ways to stop debris in the east gully.
Exit ticket: name the highest-risk zone on your map and the data that convinced you.
How confident are you that you can I can use data to describe which areas are most and least at risk for natural hazards.
Teacher notes
Materials: printed base map of a generic river valley (gully, floodplain, terrace, ridge), sample event log and well-data cards, colored pencils, the road-cut column from Part 1.
Setup: teams of four with rotating roles (Mapper, Data Reader, Recorder, Reporter). Give 20 minutes for the map. All data cards are labeled sample data.
Listen for: “coal is everywhere underground”; “the fault is the oldest thing”; shading zones by guess instead of by a data row. Some students may have lived through a flood or landslide; let them choose how much to share.
Support / stretch: give a partly shaded map and a sentence frame. Stretch: add a limestone quarry and explain where it belongs and why.