1.06 The Hazard Data Desk: Gauges, Rain and Volcanoes
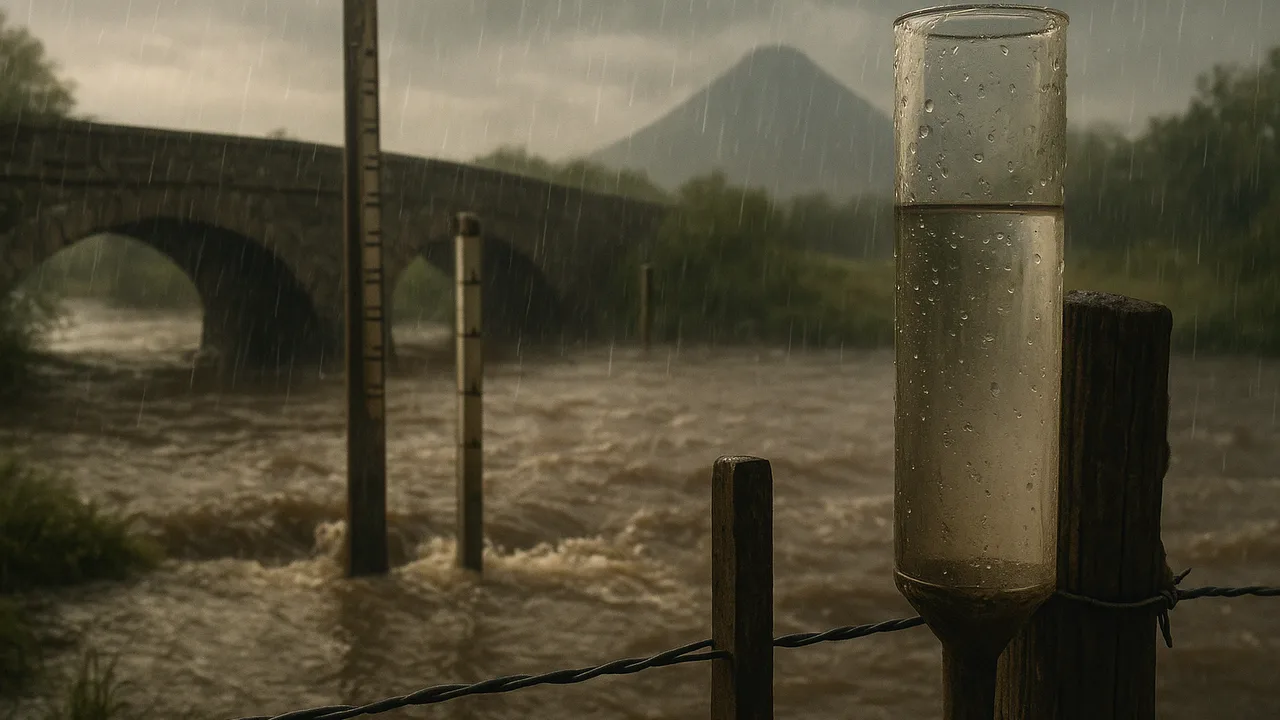
organize and analyze flood-gauge, rainfall-and-landslide and volcano monitoring data to find patterns in where and when hazards happen.
- I can arrange data about natural hazards so it is easy to analyze and interpret.
- I can describe what each set of data about natural hazards shows.
- I can analyze data to find patterns in where natural hazards happen compared to geographic or geologic features.
- I can analyze data to find patterns in how often and how severe natural hazards are, and what types of damage they cause.
- I can analyze data to find patterns in the timing or location of events that happen with natural hazards, like aftershocks or flash floods.
Phase 2: Investigate
Warm-Up ~5 min
Do Now. A river gauge reads the water’s height every hour. Sketch what you think the graph looks like during a two-day storm and the day after.
When does the river usually peak compared with the heaviest rain?
Instruction ~10 min
Explore first: three data desks. Teams rotate through three desks and fill one row per desk. All numbers are sample data made for class.
Desk A, flood gauge. Hourly river height for three days. The board set flood stage at 4.0 m (sample). Desk B, rain and slides. A table of storms with total rain and whether slides happened on the east slope. Desk C, volcano watch. Daily counts of small earthquakes, ground swelling and gas readings at a volcano in a distant range, in the weeks before it erupted.
| Desk | Hazard type | What the data measures | Pattern you see | Warning sign or threshold |
|---|---|---|---|---|
| A Flood gauge | ||||
| B Rain vs slides | ||||
| C Volcano watch |
| Desk B sample: storm total rain (mm) | 20 | 35 | 50 | 60 | 75 | 90 | 110 | 130 |
|---|---|---|---|---|---|---|---|---|
| Slide on east slope? (sample) | no | no | no | no | yes | no | yes | yes |
Name the ideas. Hazard scientists organize data by type, place, size, frequency and warning signs, then look for patterns. A threshold is a level where the chance of an event jumps, such as flood stage on a gauge or a rain total above which slides become common. Volcanoes often give warning signs: swarms of small earthquakes, swelling ground and changing gases. Earthquakes are different. Scientists can map where they are likely, along faults and plate boundaries, but they cannot predict the day one will happen.
Worked example 1: reading the gauge. Malik found the rain stopped at hour 30, but the river kept rising until hour 38, peaking at 4.6 m (sample), above flood stage. He wrote: “The river peaked about 8 hours after the rain ended, so a warning at the end of the rain would give hours to act.”
Worked example 2: finding a threshold. Ava arranged Desk B’s storms from least to most rain. No storm under 75 mm caused a slide; three of the four storms of 75 mm or more did. She described a likely threshold near 75 mm in this sample, while noting one big storm with no slide, so other factors matter too, such as how wet the soil already was.
Worked example 3: comparing hazards. Floods and slides here share a trigger, heavy rain, and both strike low or steep ground. The volcano’s signs come from underground instead. Comparing patterns helps the board decide which monitoring tools to buy.
Guided Exercises ~15 min
Use your desk notes and the sample tables.
Independent Practice ~10 min
Make the data speak.
Draw a dot graph of the Desk B sample with rain on the x-axis and “slide” or “no slide” marked. Describe the pattern in two sentences.
Compare floods and landslides in our valley. Give one way their patterns are alike and one way they differ.
Closure ~5 min
Data reveal where and when hazards strike. Next time, we measure how much punch a moving rock carries.
Exit ticket: name one hazard and the warning sign or threshold that would help the board act early.
Teacher notes
Materials: printed sample data sets for Desks A–C (gauge: steady 2.1 m, rising from hour 12, rain ends hour 30, passes 4.0 m at hour 34, peaks at 4.6 m at hour 38, back below 4.0 m by hour 46; volcano: small-quake counts rising from about 5 to 60 per day over three weeks, ground swelling a few centimeters, gas readings climbing). All values are invented sample data.
Listen for: “a threshold guarantees a disaster” (it raises the chance) and confusing forecasting with predicting exact dates. Be sensitive to students who have lived through floods or evacuations.
Support / stretch: give pre-sorted Desk B data. Stretch: suggest a second variable, such as rain in the previous week, that might explain the 90 mm storm with no slide.