1.12 Forecasting the Valley’s Hazards
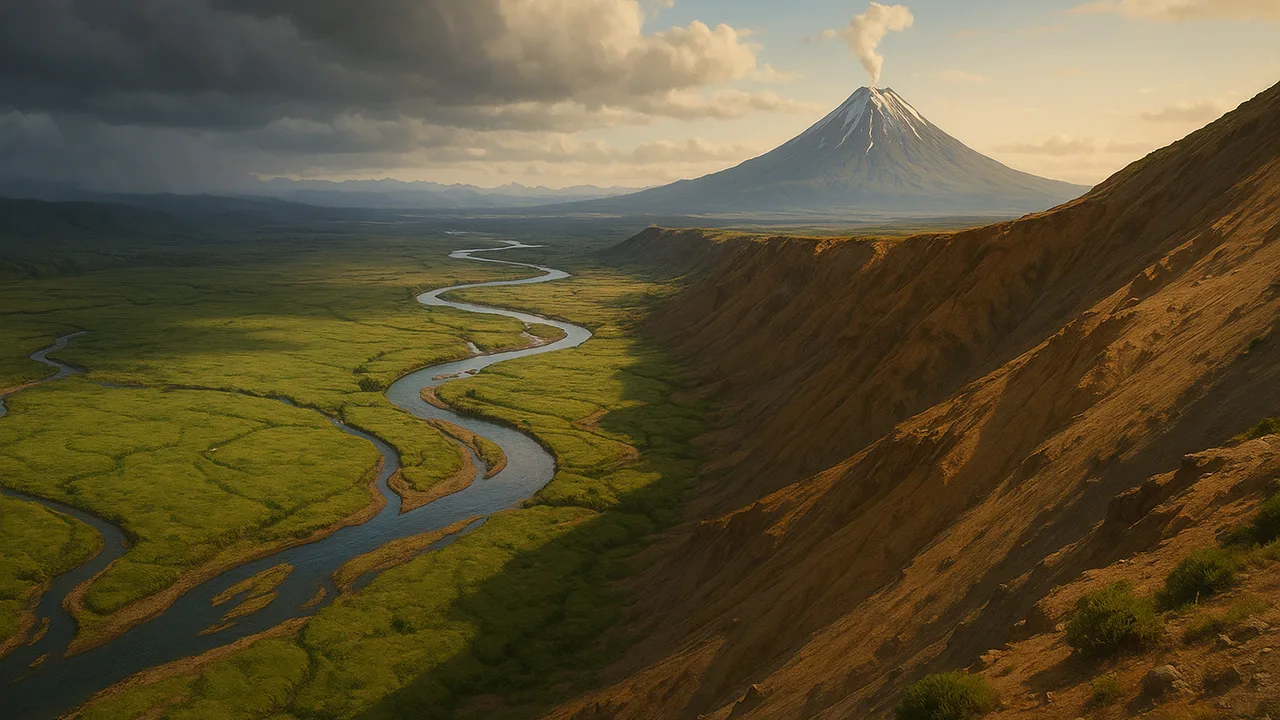
use hazard data to map the valley’s risk zones, forecast likely future events and recommend technologies that reduce their effects.
- I can use data to describe which areas are most and least at risk for natural hazards.
- I can use data to explain how often different areas are at risk for natural hazards.
- I can use data to describe what kinds of damage each area might face during a natural hazard event.
- I can use patterns in the data to forecast the chance, frequency, severity, and likely location of a future natural hazard event, and what warning signs might come first.
- I can give at least three examples of technologies engineers have made to reduce the effects of natural hazards, like earthquake-resistant buildings, warning sirens, or levees.
Phase 3: Make Sense
Warm-Up ~5 min
Do Now. A weather forecast says “70% chance of rain.” What does that mean, and what would you do differently because of it?
What is the best thing a hazard forecast can tell the board?
Instruction ~10 min
Reading: from data to forecast. A hazard map shows where an event is likely and how bad it could be. Scientists build one by combining past events, slope, soils, river heights and rain records. A forecast uses the patterns to estimate the chance, frequency, severity and likely place of a future event, plus its warning signs. Then engineers and planners choose mitigation technology. For floods: levees, floodwalls, river gauges and warning sirens. For landslides and debris flows: drainage pipes in slopes, retaining walls, debris barriers and nets, and rain-triggered alerts. For volcanoes: monitoring networks and evacuation plans. For earthquakes, which are mapped by where they are likely but not predicted in time: buildings designed to flex. Coastal towns add tsunami sensors and warning sirens.
Model first: the valley risk map. Using all your 1.06 data and the board’s map, color the valley high, medium or low risk for flooding and for debris flows. Then fill in the table.
| Zone | Hazard | Risk level | How often (sample record) | Likely damage | Warning sign | Mitigation idea |
|---|---|---|---|---|---|---|
| Riverside park and low road | ||||||
| Mill Road below east gully | ||||||
| Town center on higher terrace | ||||||
| West hills, gentle slopes |
Worked example 1: a data-based forecast. In the sample record, the park flooded in 6 of the last 20 years, always after storms that pushed the gauge above 4.0 m. Malik forecast: “The park has roughly a 30% chance of flooding in any year (6 out of 20). The warning sign is the gauge rising toward 4.0 m during a long storm.”
Worked example 2: matching technology to hazard. Mei matched Mill Road to two mitigations: a rain-gauge alert when a storm passes about 75 mm (the sample threshold), and a debris barrier in the gully. She explained that the alert protects people, while the barrier protects the homes themselves.
Guided Exercises ~15 min
Use your risk map and table. Back every answer with data.
Independent Practice ~10 min
Write the forecast memo.
Write a short forecast memo to the board for one zone. Include the hazard, its chance or frequency from the data, likely damage, the warning sign, and two mitigation technologies.
Name three technologies people have built to reduce the effects of natural hazards, and the hazard each one addresses.
Closure ~5 min
We can forecast where and how often. Next time, we measure how hard a debris flow hits, so our barrier is strong enough.
Exit ticket: which valley zone needs protection most urgently, and what data convinced you?
Teacher notes
Materials: generic valley base map, colored pencils, 1.06 data sets, a sample 20-year event record (park flooded in 6 years; Mill Road debris reached the road in 2 years). All records are sample data.
Listen for: “a 30% chance means it floods every third year” and any claim that earthquakes can be predicted in time.
Sensitivity: keep tone calm and practical. Emphasize that forecasts and mitigation exist to keep people safe.
Support / stretch: give a partly colored map. Stretch: add a volcano or coastal tsunami zone to a second map and forecast it.