2.03 No Two Seeds Alike: Measuring Variation
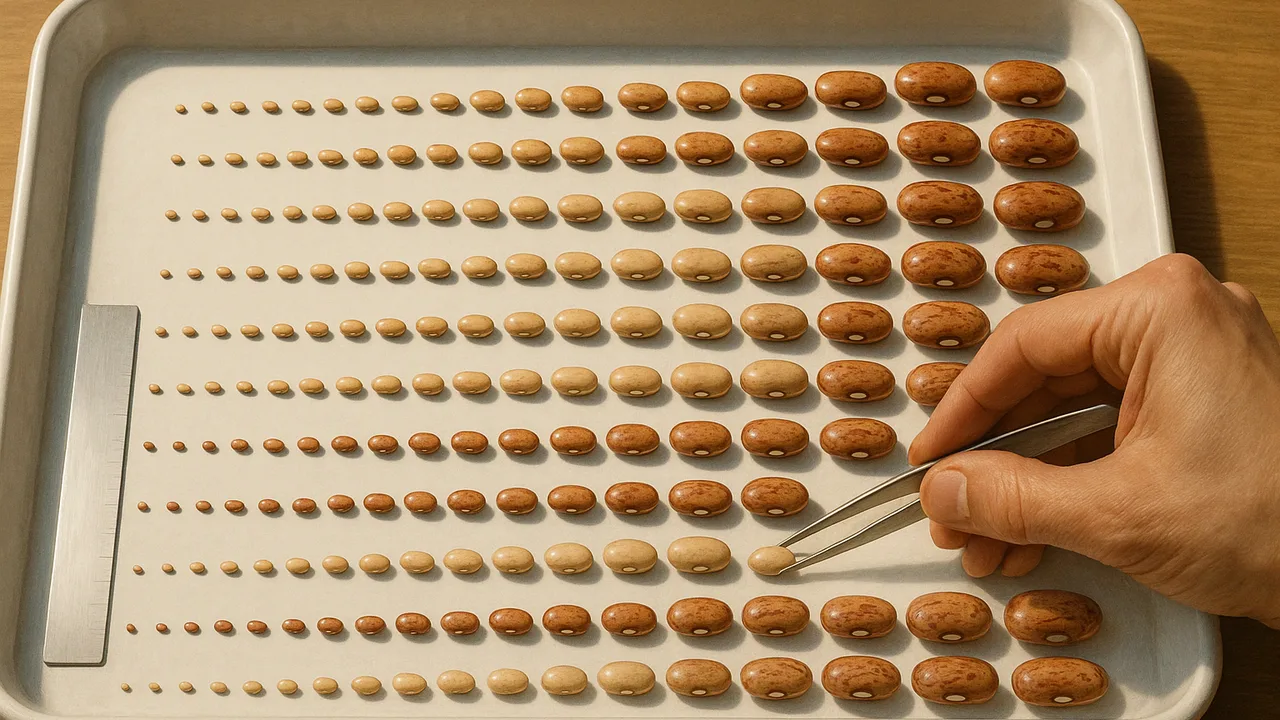
measure a trait in a sample of seeds and use a frequency graph to describe the variation in a population.
- I can identify and describe evidence showing that individuals in a species have genetic variations that can be passed to their offspring.
- I can describe how to use probability to determine the chances of an organism surviving and reproducing in a specific environment.
- I can explain the cause-and-effect relationship between specific traits, their genetic variations, and the probability of survival and reproduction in a given environment.
- I can explain that populations have a variety of inheritable genetic traits, and that these variations come from genetic differences.
- I can describe how some traits give organisms advantages in certain environments, making it more likely they will survive and reproduce.
- I can use reasoning to show how natural selection causes the proportion of advantageous traits to increase and disadvantageous traits to decrease in a population over generations.
- I can identify population changes, such as trends or averages, using data from graphs, charts, or simulations.
- I can find information about how specific traits are distributed in a population over time using data or simulations.
- I can identify changes in environmental conditions, like climate or resources, over time using data or simulations.
Phase 2: Investigate
Warm-Up ~5 min
Do Now. Your team has a cup of 30 dried beans of one variety. Before measuring, predict what a graph of their lengths will look like.
If you graph the lengths of 30 beans of one variety, you will most likely see…
Instruction ~10 min
Explore first. Measure the length of each bean to the nearest millimeter. Then sort the beans into length groups and count each group. Record your counts here, then make a bar graph with length groups on the x-axis and number of beans on the y-axis.
| Length group (mm) | Tally | Number of beans | Percent of sample |
|---|---|---|---|
| 10–11 | |||
| 12–13 | |||
| 14–15 | |||
| 16–17 | |||
| 18–19 | |||
| Total | 30 | 100% |
Option B: classmates’ traits. If seeds are not available, survey traits that are easy to see and comfortable to share, such as hand span or whether you can roll your tongue. Keep all data anonymous.
Name the ideas. A population is a group of the same kind of organism living in one place. The differences you measured are variation. Some of it is inherited, carried by genes, and some comes from growing conditions. The pattern of how many individuals have each trait value is the trait’s distribution.
Worked example 1: reading a distribution. Sample data: Priya’s team counted 2, 6, 12, 7 and 3 beans in the five length groups. The tallest bar is 14–15 mm, with 12 of 30 beans. That is 12 ÷ 30 = 0.40, or 40% of the sample. Fewer beans sit at the extremes: 2 of 30 is about 7%.
Worked example 2: evidence that variation is inherited. Sample data: Jamal plants the five longest and five shortest beans in identical pots. Their offspring’s seeds average 17 mm and 12 mm. Because the conditions were the same, the difference points to inherited variation that parents pass to offspring.
Guided Exercises ~15 min
Use your team’s table and graph for these cards.
Independent Practice ~10 min
Explain your graph.
Describe your bean-length distribution: where is the peak, how wide is the spread, and what percent of beans are in the tallest bar? Use numbers from your table.
Plan a fair test to find out whether drought survival in beans is inherited. Name what you would keep the same and what you would measure.
Closure ~5 min
Populations vary, and some of that variation is inherited. Next time, we compare two ways plants reproduce and ask which one makes more variety.
Exit ticket: give one piece of evidence that individuals in a population have inherited variations they can pass to offspring.
Teacher notes
Materials (per team): 30 dried beans of one variety (lima or kidney beans work well), metric rulers or calipers, sorting cups, graph paper.
Setup: adjust the length groups to fit your beans; lima beans run longer than navy beans. Combine team data into a class graph for a smoother distribution.
Listen for: “the big beans are healthier” (size is not the same as fitness) and “variation is a mistake.” If you use the classmate option, choose neutral traits, keep data anonymous and avoid height or weight. Note that tongue rolling is often taught as a simple single-gene trait but is not; use it only as an example of variation.
Support / stretch: give a pre-labeled graph frame and a percent calculator strip. Stretch: compare your team’s distribution with the class distribution and explain why a bigger sample gives a clearer pattern.