1.13 Reading the Pilot Data: Heat Source Plus Sleeve
analyze pilot test data from three warmer setups to judge how well each meets the criteria and propose an evidence-based improvement.
- I can use my test results to analyze how well my device meets the criteria and constraints, and identify which parts of my design worked best.
- I can test my device and use the rate of temperature change to measure how well it minimizes or maximizes thermal energy transfer.
- I can use what I know about thermal energy transfer and my test results to evaluate how well my device meets the criteria and constraints.
Phase 3: Make Sense
Warm-Up ~5 min
Do Now. Your teacher ran a quick pilot test of three warmer setups. Before you see the data, predict which setup will keep the “meal” warmest at 20 minutes.
Which setup will keep the meal warmest at 20 minutes?
Instruction ~10 min
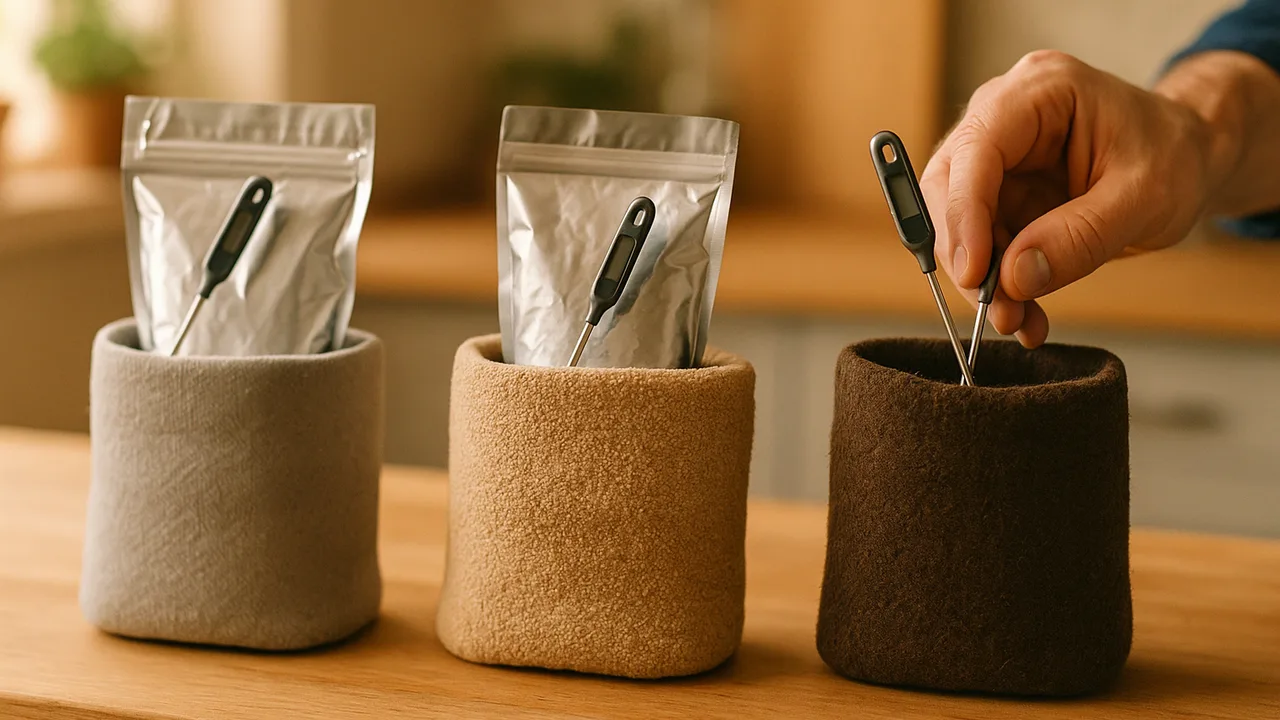
The pilot test. The teacher placed a bag of activated calcium chloride solution against a pouch of 100 g of water, our stand-in meal. The meal started at 20°C. These are sample data.
| Setup | 0 min (°C) | 5 min | 10 min | 15 min | 20 min | Outside at 10 min |
|---|---|---|---|---|---|---|
| 1: 10 g, no sleeve | 20 | 25 | 27 | 26 | 25 | 31 |
| 2: 10 g, foam sleeve | 20 | 27 | 30 | 30 | 29 | 23 |
| 3: 20 g, foam sleeve | 20 | 32 | 37 | 36 | 35 | 25 |
Our criteria, from 1.09. Raise the meal at least 15°C within 10 minutes. Keep it at least 10°C above its start at 20 minutes. Keep the outside comfortable to hold. Use no more than 20 g of heater material.
Worked example 1: rate of change. Setup 3 rose from 20°C to 32°C in the first 5 minutes, a rate of about 2.4°C per minute. From 10 to 20 minutes it fell 2°C, a slow loss of about 0.2°C per minute. A slow loss means the sleeve is doing its job of minimizing energy transfer to the air.
Worked example 2: judging against criteria. Setup 3 rose 17°C by 10 minutes, which meets the 15°C target. At 20 minutes it was 15°C above its start, which meets the second criterion. It used 20 g, exactly at the limit. Setup 2 rose only 10°C, so it misses the first criterion even with a sleeve.
From data to improvement. Engineers ask which part of the design made the difference. Comparing Setups 1 and 2 isolates the sleeve. Comparing Setups 2 and 3 isolates the amount of heater material.
Guided Exercises ~15 min
Use the pilot data table. Work with your team on each card.
Independent Practice ~10 min
Analyze, judge and improve.
Graph the three setups on one set of axes. For each, write whether it meets each criterion, with the data value that shows it.
Propose one change to Setup 3 that stays within 20 g. Predict how the data would change and explain why, using energy transfer.
Closure ~5 min
Data tell us which parts of a design work. Next time, we brainstorm many designs for our clients before choosing what to build.
Exit ticket: explain how the foam sleeve changed the movement of thermal energy in Setup 2 compared with Setup 1. Use one rate or temperature from the table.
Teacher notes
Materials: pilot data table (sample data), graph paper. If you can, run Setup 3 live as a teacher demo with goggles, 20 g of calcium chloride in 50 mL of water in a zip bag set against a bag of 100 g water inside a foam sleeve.
Setup: the sample values are plausible classroom-scale results, not measurements from a real product. Swap in your demo data if it differs.
Listen for: “foam heats the food.” Foam only slows transfer. Rates are temperature changes per minute, never total energy. This lesson builds analysis skills; teams test their own prototypes in part 2.
Support / stretch: pre-highlight the columns needed for each criterion. Stretch: estimate when Setup 3 will drop below 10°C above its start, and explain the assumption you made.