1.03 Mix or Reaction? Properties Before and After
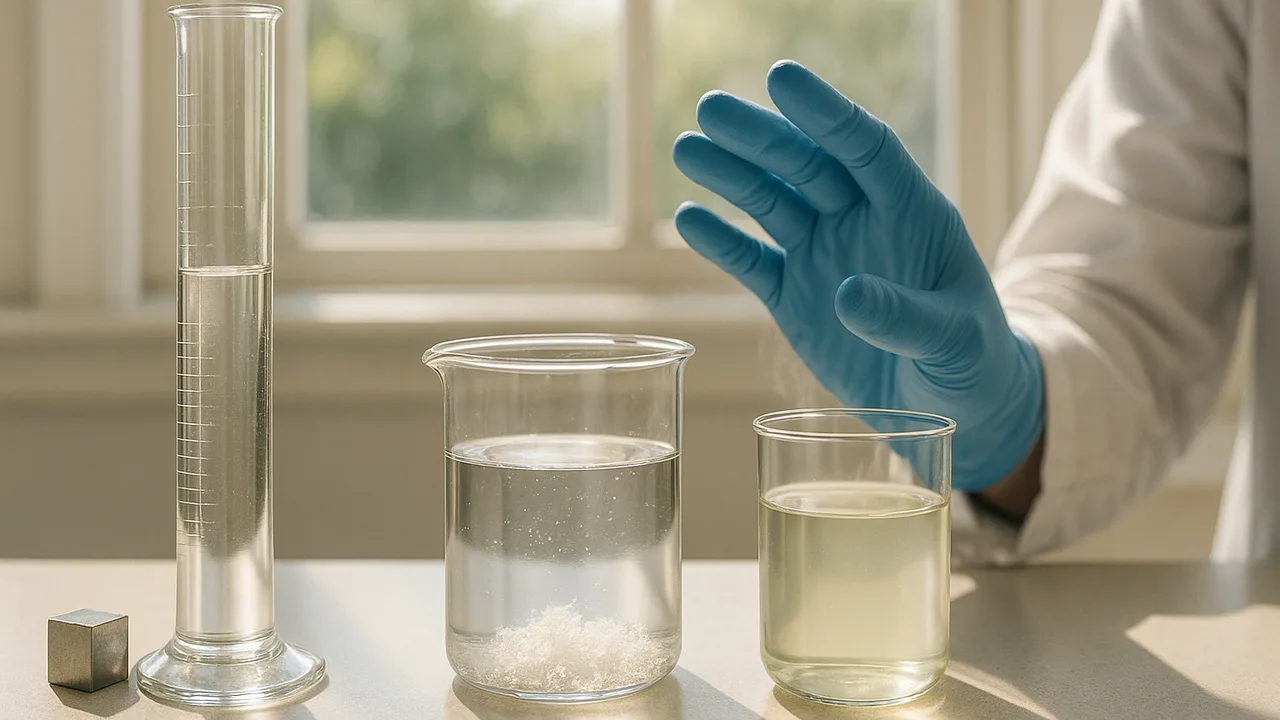
measure and organize density, solubility and odor data, plus reference melting points, to compare substances before and after they interact.
- I can organize data about the density, melting point, boiling point, solubility, flammability, and odor of substances before and after they interact.
- I can arrange data about substance properties in tables, charts, or graphs to make it easier to analyze and interpret.
Phase 2: Investigate
Warm-Up ~5 min
Do Now. Two beakers sit at the front. In one, your teacher stirs salt into water. In the other, they add baking soda to vinegar. Write one observation about each beaker.
Which beaker still contains the same substances it started with?
Instruction ~10 min
Explore first. Your team visits three stations. Measure or observe each property before and after the substances meet. Record everything in the table, even when nothing changes.
| Station | Property | Before | After | Same or different? |
|---|---|---|---|---|
| A: salt + water | Odor | |||
| A: salt + water | Solubility of the solid | |||
| A: salt + water | Density of liquid (g/mL) | |||
| B: baking soda + vinegar | Odor | |||
| B: baking soda + vinegar | Solubility of the solid | |||
| B: baking soda + vinegar | Density of liquid (g/mL) | |||
| C: sugar + water | Odor | |||
| C: sugar + water | Density of liquid (g/mL) |
Name the ideas. A property describes a substance. Each pure substance has its own set of properties, like a fingerprint. Density is mass divided by volume. Solubility describes how well a substance dissolves. Melting point is the temperature at which a solid becomes a liquid. If the properties after an interaction match the properties before, you probably made a mixture. If new properties appear, new substances may have formed.
Worked example 1: finding density. These are sample numbers. Jamal measured 50.0 mL of a liquid with a mass of 53.0 g. Density = mass ÷ volume = 53.0 g ÷ 50.0 mL = 1.06 g/mL. A different density after an interaction is one clue that something new is present.
Worked example 2: reading a reference table. Water ice melts at 0°C. Table salt melts at about 800°C. If Mei evaporates salt water and the white crystals left behind still melt only at a very high temperature, they behave like salt. The salt never changed into anything new.
Organize to see patterns. Data in a table lines up the before and after values side by side. That makes changes easy to spot.
Guided Exercises ~15 min
Use your station data. Discuss each card with your team.
Independent Practice ~10 min
Make the pattern visible.
Make a bar graph of the density of each liquid before and after, for Stations A and B. Describe the pattern you see.
Which station do you think formed a new substance? List two properties from your table as evidence.
Closure ~5 min
Some interactions keep every property; others change them. Next time, we look for the signs that a chemical reaction has happened.
Exit ticket: explain how comparing properties before and after can tell a mixture from a new substance. Use one row from your table.
Teacher notes
Materials (per team): goggles, table salt, baking soda, white vinegar, sugar, 50 mL graduated cylinders, an electronic balance, plastic cups, spoons, a printed melting-point reference card (water 0°C; table salt about 800°C).
Setup: for Station B, let a pre-reacted batch finish fizzing before class, so teams can measure the after-liquid’s density. Students tare a cup, add 50 mL of liquid and read the mass.
Listen for: “salt disappeared, so it changed.” Dissolving hides a substance but does not change it; evaporation brings it back. Expect small density differences; ask students to compare with care and repeat measurements. Keep melting points to the reference card; we do not measure them in class.
Support / stretch: give a density calculator frame: ___ g ÷ ___ mL = ___ g/mL. Stretch: predict the boiling point of salt water compared with pure water and explain how you could test it.