2.17 Test Round 1: What the Drop Data Say
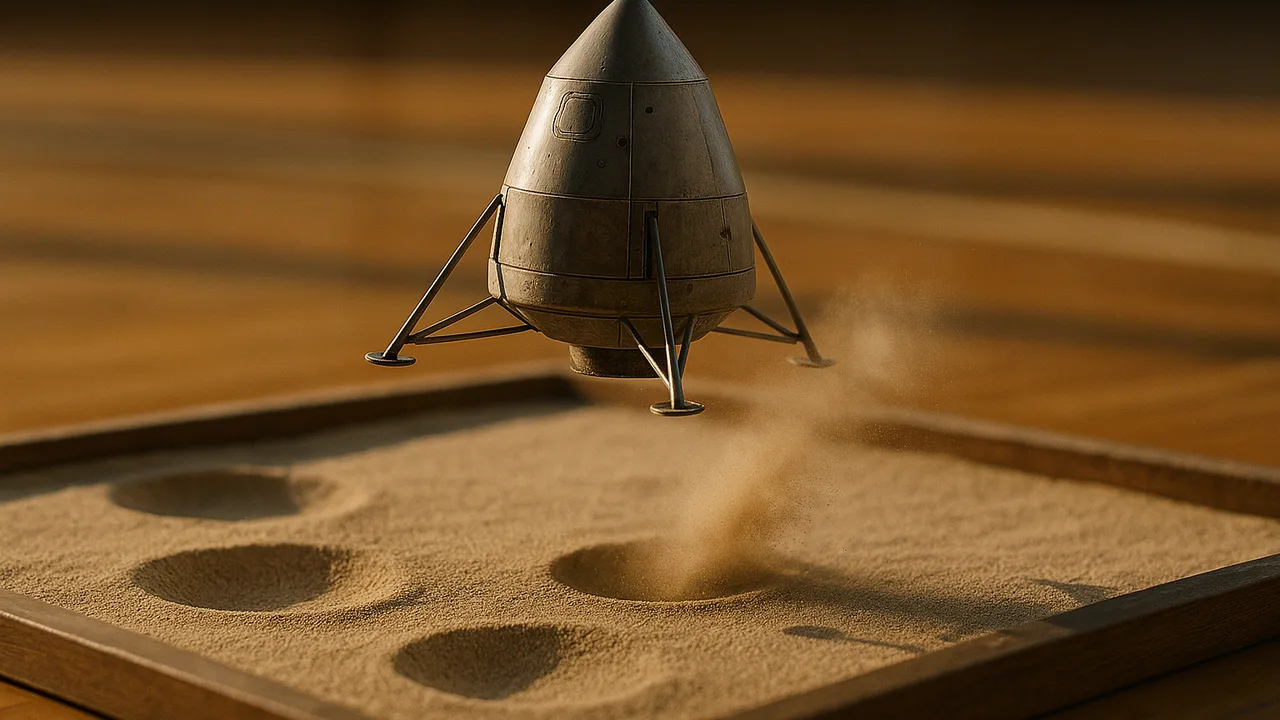
run the drop tests, organize the data from three designs, and analyze how each one meets the criteria and constraints.
- I can organize data from tests of three or more design solutions using tables, charts, or graphs.
- I can analyze data using methods like comparing numbers or looking for patterns.
- I can identify how each design solution meets the criteria and fits the constraints by examining the data.
- I can use data to explain similarities and differences between the features of different design solutions.
Phase 4: Build
Warm-Up ~5 min
Do Now. Look at your team’s design. Write one sentence: “I think our lander will (survive / fail) because …” Keep it. You will check it against the data.
How confident are you that you can I can organize test data from several designs in a table.
Instruction ~10 min
Mission engineers, today is test day. Every team drops its prototype three times from 2.0 m. The Recorder writes every result, even the messy ones. Then we pool the class data in one table.
Organizing data. A good table puts each design in a row. It puts each measurement in a column with units. A success rate is a fast way to compare designs: successes out of total trials, such as 4 out of 6.
Worked example 1: a sample class table. These are sample numbers, not real results. Each design had two teams and three trials per team, so six trials each.
| Design | Mass (g) | Payload OK | Upright | Open in <1 min? |
|---|---|---|---|---|
| A Crumple Base | 95 | 4 of 6 | 5 of 6 | yes |
| B Spring Legs | 80 | 2 of 6 | 2 of 6 | yes |
| C Cushion Cage | 140 | 6 of 6 | 1 of 6 | no |
Worked example 2: analyzing the table. Malik compares the rows. Design C protects best, 6 of 6, but it rolls over and is slow to open. It is also close to the 150 g limit. Design A is the best all-rounder: good protection and usually upright. Design B is lightest, but its legs fold and it tips. Malik writes: “No design meets every criterion yet.”
A blank class table is below. Fill it in with your real results.
| Design | Mass (g) | Payload OK (out of trials) | Upright (out of trials) | Open in <1 min? | Under 150 g and 20 cm? |
|---|---|---|---|---|---|
| A | |||||
| B | |||||
| C |
Guided Exercises ~15 min
Use the sample table first, then your class table.
Independent Practice ~10 min
Write a short data analysis.
For each design, name one criterion it met and one it missed. Use numbers from your class table as evidence.
Describe one feature that made two designs perform differently. Use the data to explain the difference.
Closure ~5 min
The data show strengths and weak spots in every design. Next, we steal the best features and combine them.
Exit ticket: which design feature from another team do you most want to borrow? Use one data point to explain why.
Teacher notes
Materials: prototypes, 2.0 m tape mark, step stool (teacher only), drop tarp or plastic sheet, paper towels, zip bags, eggs or water balloons, scale, class data sheet on the board.
Setup: run a drop station where the teacher releases and a student Tester inspects. Keep a strict order so every team gets three drops. If eggs run short, use water balloons for some trials and note it as a controlled-variable change.
Listen for: teams ignoring failed trials, or averaging yes/no results. Model success rates as fractions.
Support / stretch: give a partly filled graph with axes and labels. Stretch: compare success rates as percentages and discuss how few trials limit confidence.