1.06 The Insulation Test Lab
run a fair test to compare how well different materials slow the flow of thermal energy and use the data to set a numerical criterion.
- I can use my model to explain how adding or removing thermal energy changes the average kinetic energy of the particles in a substance.
- I can define the criteria for a solution that meet the needs of the people or groups affected by the problem.
- I can explain who the solution is meant to help and use criteria to compare different solutions, including using numbers when needed.
Phase 2: Investigate
Warm-Up ~5 min
Do Now. Your teacher places one ice cube on an aluminum block and an identical ice cube on a foam tray. Both sit at room temperature. Feel each surface first. Which one feels colder?
Which ice cube will melt faster?
Instruction ~10 min
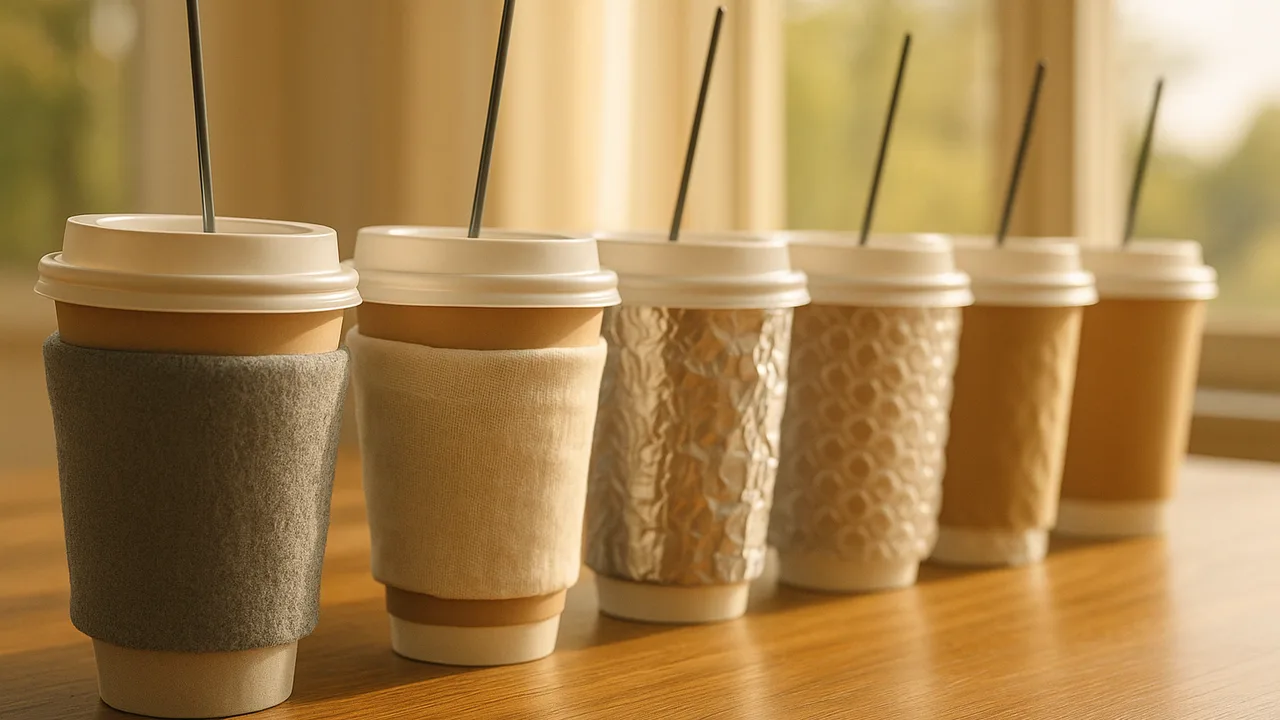
The test. Each team wraps five identical cups in different materials: foam, cloth, aluminum foil, newspaper and bubble wrap. A sixth cup stays bare as the control. Your teacher fills each cup with the same amount of warm tap water. Cover each cup with a matching lid. Record the temperature every five minutes.
Why warm water, when we want cold food? Thermal energy always moves from warmer matter to cooler matter. A material that slows energy leaving warm water also slows energy entering cold food. Warm water simply gives bigger changes to measure in one class period.
| Wrap material | Start (°C) | 5 min | 10 min | 15 min | 20 min | Total drop (°C) | Rank (1 = slowest drop) |
|---|---|---|---|---|---|---|---|
| None (control) | |||||||
| Foam | |||||||
| Cloth | |||||||
| Aluminum foil | |||||||
| Newspaper | |||||||
| Bubble wrap |
Worked example 1: a fair test. Ava’s team kept everything the same except the wrap: the same cups, the same amount of water, the same starting temperature and the same lids. The wrap is the independent variable. The temperature drop is the dependent variable. Everything else is controlled.
Worked example 2: turning data into a criterion. These numbers are only a sample. Suppose the bare cup dropped 14°C in 20 minutes and the foam cup dropped 5°C. Malik’s team wrote a criterion with a number: “Our wall material must slow energy at least as well as foam: a drop of 6°C or less in 20 minutes.” A number lets us compare designs fairly.
Naming the idea. A material that slows the flow of thermal energy is an insulator. A material that lets it flow easily, like most metals, is a conductor. Look closely at the best insulators. What do many of them trap?
Guided Exercises ~15 min
Analyze your class results together. Use your table as evidence for each answer.
Independent Practice ~10 min
Use your own team’s data.
Make a bar graph of the total temperature drop for each wrap. Then write one criterion with a number for our cooler's walls, based on your data.
How confident are you that you can I can compare insulators with a fair test and turn data into a criterion.
Closure ~5 min
Some materials slow thermal energy much better than others, and trapped air seems important. Next time, we explore packs that warm up or cool down with no plug at all.
Exit ticket: which wrap would you choose for a cooler wall, and what number from your data supports that choice?
Teacher notes
Materials (per team): 6 identical paper or plastic cups with lids (or cardboard squares), foam sheet or a cut-up foam tray, cloth, aluminum foil, newspaper, bubble wrap, tape, a thermometer or probe per cup if possible, a timer. Teacher: warm tap water (about 40–45°C), an aluminum block or metal baking pan, a foam tray, 2 ice cubes.
Setup: wrap cups before pouring. Wrap each cup with the same number of layers. Pour water and start timers quickly so starts match.
Listen for: “foil is the best because it is shiny.” Foil reflects sunlight, which helps outdoors, but a single foil layer conducts and holds little air, so it usually does poorly here. Foil earns a second look as an outer layer in the sun. Results vary by wrap thickness; trust the data.
Support / stretch: give a partly filled table and a graph template. Stretch: test two layers versus one layer of the same material.