1.19 First Heat Test: Thermometer and Data Log
run a fair heat test on version 1, record temperature and ice-melt data, and explain the results with a particle model.
- I can use my model to explain how adding or removing thermal energy changes the average kinetic energy of the particles in a substance.
- I can use my model to explain how adding thermal energy can increase the temperature or cause a substance to change from solid to liquid or liquid to gas.
- I can show how, in a gas, adding thermal energy makes molecules move faster and collide harder, which increases pressure.
- I can use my model to explain how removing thermal energy can decrease the temperature or cause a substance to change from gas to liquid or liquid to solid.
- I can show how, in a gas, removing thermal energy makes molecules move slower and collide less forcefully, which decreases pressure.
Phase 4: Build
Warm-Up ~5 min
Do Now. A glass of ice water sits on a table. A thermometer in it reads 0 °C for many minutes, even while the ice melts. Where is the incoming thermal energy going?
While ice is melting in water, what happens to the temperature of the ice water?
Instruction ~10 min
Design engineers, a test is only useful if it is fair. Every team uses the same setup, so differences in data come from the design, not the test.
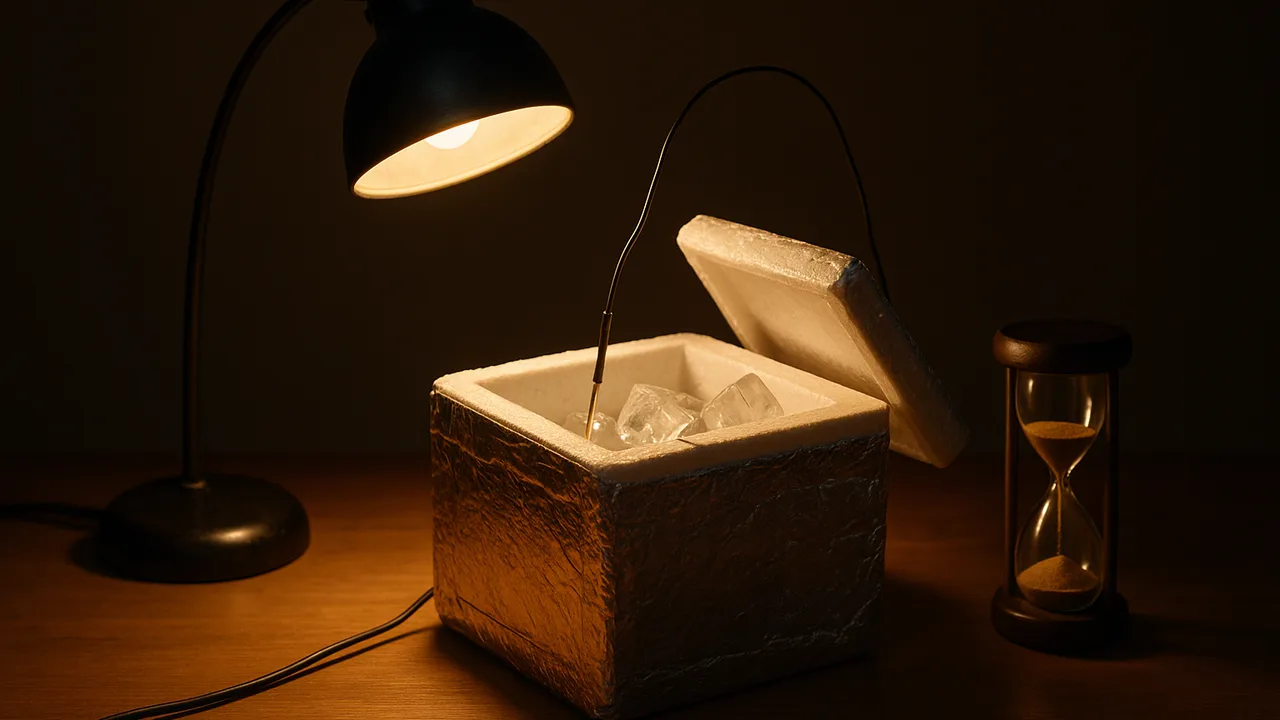
Our test setup. Each cooler gets one 200 g bag of ice and one sealed 250 mL bottle of water from the fridge, our stand-in lunch. The thermometer probe goes inside through the sealed hole. All coolers sit in the same warm spot. We read the temperature every 10 minutes without opening the lid. At the end, we pour off and measure the meltwater.
Thermal energy is not the same as temperature. Temperature is the average motion energy of the particles. Thermal energy is the total motion energy of all of them. A big bag of ice holds more thermal energy than a small one at the same temperature, simply because it has more particles.
Worked example 1: reading a data log. These are sample numbers. Team Ava’s cooler read 2.5, 3.0, 3.5, 4.5 and 5.0 °C over 40 minutes. Team Malik’s read 2.0, 2.0, 2.5, 2.5 and 3.0 °C. Ava’s rose 2.5 °C; Malik’s rose only 1.0 °C. Ava’s crossed our 4 °C line after about 30 minutes, so it fails that criterion.
Worked example 2: explaining with particles. Ava’s team measured 35 g of meltwater; Malik’s measured 15 g. More thermal energy entered Ava’s cooler. That energy sped up ice particles until they broke out of their repeating pattern and became liquid. Meanwhile, the lunch water gave some of its thermal energy to the ice, so its particles slowed and its temperature dropped. Thermal energy always moves from warmer to cooler matter.
| Time (min) | Temperature inside (°C) | Room temperature (°C) | Notes |
|---|---|---|---|
| 0 | |||
| 10 | |||
| 20 | |||
| 30 | |||
| 40 | |||
| Meltwater (g or mL) | |||
Guided Exercises ~15 min
Answer these between readings. Do not open the lid.
Independent Practice ~10 min
Analyze your own data.
Make a line graph of your temperature data. Did your cooler meet the 4 °C criterion? Did it keep half the ice? Use numbers.
Explain your meltwater result using particles. Describe what happened to the ice particles and to the lunch water particles.
Closure ~5 min
Now you have data, not guesses. Next class is the mid-build checkpoint, then peer critique.
Exit ticket: a criterion must be measurable. Rewrite one of our criteria so it includes a number and a unit.
How confident are you that you can I can explain how adding or removing thermal energy changes particle motion, temperature and state.
Teacher notes
Materials: each team’s version 1, one 200 g bag of ice per team (weigh in zip bags), sealed 250 mL bottles of fridge water, digital probe thermometers, a measuring cup or scale for meltwater, towels.
Setup: place all coolers in the same warm spot (a sunny window or near a heater, never on it). Run 40 minutes of readings. A 40-minute test is short, so differences may be small; that is useful data.
Listen for: “the ice gave cold to the water” (the water gave thermal energy to the ice); students opening lids to check.
Support / stretch: provide graph paper with axes labeled. Stretch: calculate the average rise in temperature per 10 minutes.