1.05 Ice to Water to Steam: The Temperature-Time Graph
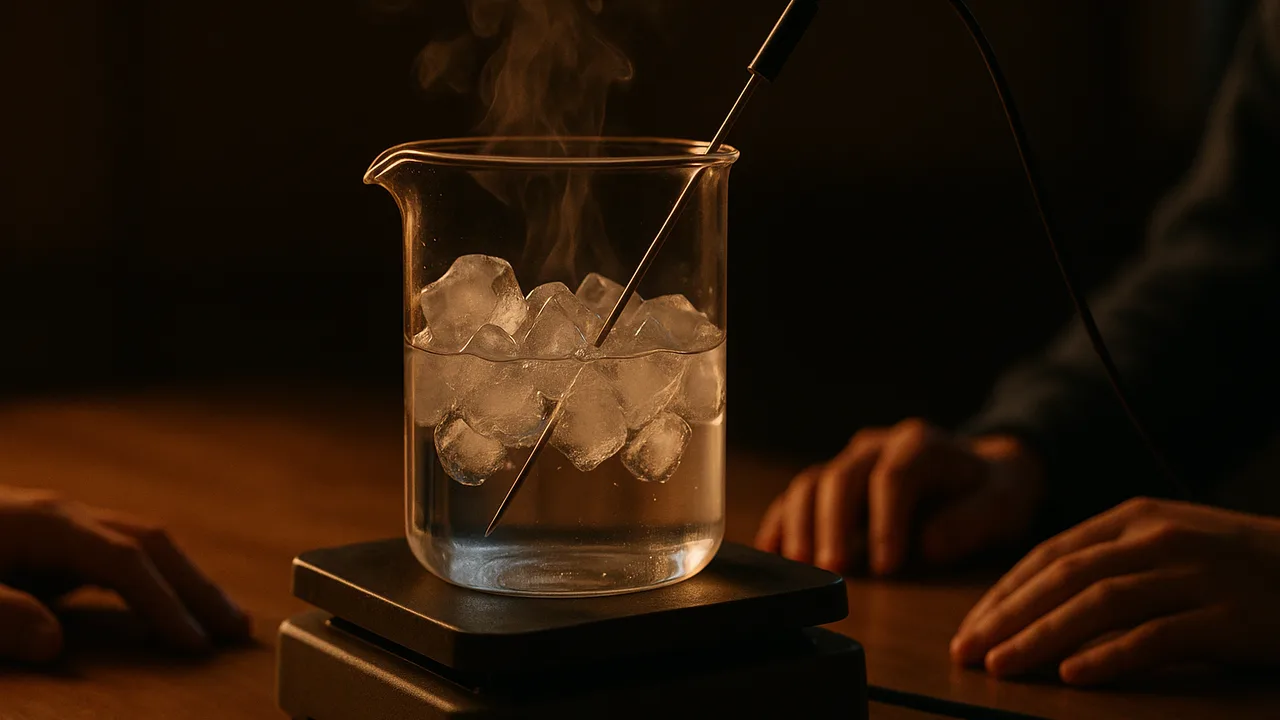
collect temperature data as ice is heated and graph it to find when temperature rises and when it stays flat.
- I can create a model that shows particles and how they move in a pure substance.
- I can identify and show the system where the particles are contained, including the temperature, thermal energy, and average kinetic energy.
- I can use my model to show a pure substance as a solid, liquid, or gas.
- I can use my model to explain how adding thermal energy can increase the temperature or cause a substance to change from solid to liquid or liquid to gas.
- I can show how, in a gas, adding thermal energy makes molecules move faster and collide harder, which increases pressure.
- I can use my model to explain how removing thermal energy can decrease the temperature or cause a substance to change from gas to liquid or liquid to solid.
- I can show how, in a gas, removing thermal energy makes molecules move slower and collide less forcefully, which decreases pressure.
Phase 2: Investigate
Warm-Up ~5 min
Do Now. Your teacher puts a beaker of crushed ice on a hot plate. A temperature probe sits in the ice. The hot plate stays on the same setting the whole time.
While the hot plate stays on, how will the temperature change?
Instruction ~10 min
Cooler engineers, today you are data collectors. Read the probe every minute and describe what you see in the beaker. Your teacher stirs gently so the reading is fair. Fill in the table, then graph time on the x-axis and temperature on the y-axis.
| Time (min) | Temperature (°C) | What I see (ice, water, bubbles, steam) |
|---|---|---|
| 0 | ||
| 1 | ||
| 2 | ||
| 3 | ||
| 4 | ||
| 5 | ||
| 6 | ||
| 7 | ||
| 8 | ||
| 9 | ||
| 10 | ||
| 12 | ||
| 14 | ||
| 16 | ||
| 18 | ||
| 20 |
Worked example 1: reading a sample graph. These are sample results; your class data will differ. Jamal’s graph started at −5°C and climbed to 0°C. Then the line went flat for six minutes while the ice melted. After the last ice disappeared, the line climbed steeply. Near 100°C, with big bubbles rising, it went flat again.
Naming what we saw. The hot plate adds thermal energy the whole time. On the sloped parts, that energy raises the temperature. On the flat parts, the energy goes into changing the state: solid ice to liquid water at 0°C, and liquid water to gas at the boiling point. Pure water boils near 100°C at sea level, and a little lower at higher elevations.
Worked example 2: running it backward. Mei put a cup of room temperature water in a freezer with a probe. Her sample graph sloped down to 0°C. It stayed flat while the water froze, then sloped down again. Removing thermal energy lowers temperature or causes freezing, the reverse of heating.
Why this matters for our cooler. Look at that first flat line. While ice is melting, it stays at 0°C. Keep that clue for our design.
Guided Exercises ~15 min
Use your class graph to answer. Point to the part of the graph that proves each answer.
Independent Practice ~10 min
Interpret the data on your own.
Label each section of your graph: solid warming, melting, liquid warming, boiling. Then write two sentences about where the thermal energy went on the flat parts.
How confident are you that you can I can read a temperature-time graph and explain the flat parts.
Closure ~5 min
Energy went in the whole time, but the temperature did not always rise. Next time, we test which materials slow down the flow of thermal energy.
Exit ticket: why might melting ice be useful inside a lunch cooler? Use our graph as evidence.
Teacher notes
Materials: 400–600 mL heat-safe beaker, crushed ice (freezer-cold, ideally below 0°C), hot plate, digital probe or projected thermometer, stirring rod, goggles, graph paper. Optional: probeware that graphs live.
Setup: run it as a teacher demo with live projection. Stir steadily; unstirred water near the plate can read above 0°C before the ice is gone. Boiling in a classroom often reads 98–100°C depending on elevation and the probe. Pre-record a run in case the period is short.
Listen for: “hot plate turned off” or “the thermometer broke” during plateaus. Keep MS-PS1-4 qualitative: no specific heat or latent heat calculations. Temperature and thermal energy are named today and distinguished in 1.11.
Support / stretch: provide axes pre-labeled with a scale. Stretch: predict how the graph would change with twice as much ice.