4.09 Map Detectives: Where Earth’s Features Are
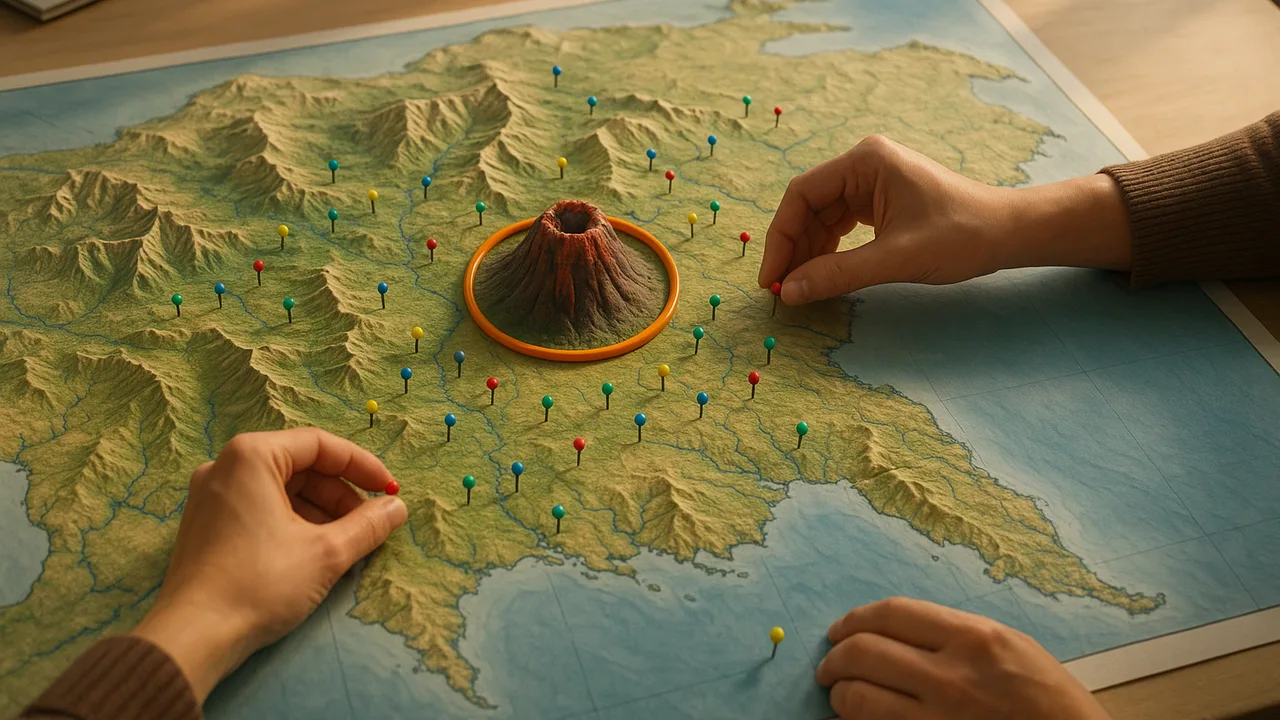
organize data from maps of mountains, volcanoes, earthquakes and ocean features into a table, and look for patterns in where they are.
- I can organize data from maps of Earth’s features by making a table, chart, or graph.
- I can find patterns in where mountain ranges, deep ocean trenches, and ocean floor structures are located.
- I can identify that volcanoes and earthquakes often happen in bands along the edges of continents and oceans.
- I can show that major mountain chains form inside continents or near their edges.
Phase 2: Investigate
Warm-Up ~5 min
Do Now. Look at the world map on the wall. Put your finger on the place where you live. Now find one ocean and one big mountain range.
On a world map of volcanoes, how do you think the volcanoes are spread out?
Instruction ~10 min
Junior scientists, welcome to map detective work. Each team gets three maps of the world. One shows major mountain ranges. One shows volcanoes and earthquakes. One shows the shape of the ocean floor. Use the map key to read each symbol.
Explore first. Look for 3 minutes before you write. Where are the marks crowded? Where are they empty? Talk with your team.
Organize the data. A map holds lots of data. A table makes it easier to see. We will sort each feature into one of three places: near the edge of a continent, in the middle of a continent or in the ocean. Make a tally mark for each one.
Worked example 1: the Andes. Priya finds the Andes Mountains. They run along the whole west side of South America. She tallies them under “near the edge of a continent.” She also notices many volcano symbols along the same edge.
Worked example 2: the ocean floor. Diego looks at the ocean-floor map. He finds a long underwater mountain range running down the middle of the Atlantic Ocean. He also finds deep trenches in the Pacific Ocean, near island chains and coasts. He tallies them under “in the ocean.”
An old mountain range. Find the Appalachian Mountains. They run through the eastern part of North America. Are there volcano symbols nearby? (The Appalachians have no active volcanoes.)
Guided Exercises ~15 min
Fill in the tally table. The Recorder makes the marks. Each team member reads a different part of the map.
| Feature | Near the edge of a continent | In the middle of a continent | In the ocean | Pattern we notice |
|---|---|---|---|---|
| Mountain ranges | ||||
| Volcanoes | ||||
| Earthquake areas | ||||
| Ocean trenches and ridges |
Independent Practice ~10 min
Use your table, not just the map.
Make a bar graph from one row of your tally table. Give it a title and label both sides.
Find the Appalachian Mountains. Are they near volcanoes on the map? What does that make you wonder?
Closure ~5 min
Maps are full of data, and tables help us see patterns. Next, the Make Sense phase begins. We will use all our data to explain how Earth’s surface changes. Take your last freeze-and-thaw count today.
Exit ticket: which column of your tally table had the most volcanoes? What does that tell you?
Teacher notes
Materials: printed world maps for each team: major mountain ranges, volcanoes and earthquakes (the USGS and NOAA publish free classroom versions), and ocean-floor relief. Tally tables, graph paper, a wall map.
Setup: Laminate maps if possible. Pre-mark the edges of continents with a thin line for teams that need help sorting.
Listen for: “volcanoes are everywhere.” Ask students to point to empty areas. Some features, like Hawaii’s volcanoes, sit far from any edge; welcome them as interesting exceptions. Keep the focus on patterns, not on explaining plate movement.
Support / stretch: Give some teams only the volcano and mountain maps. Stretch: compare the volcano band and the earthquake band. Do they overlap?