4.04 Fair Tests: Measuring the Mud
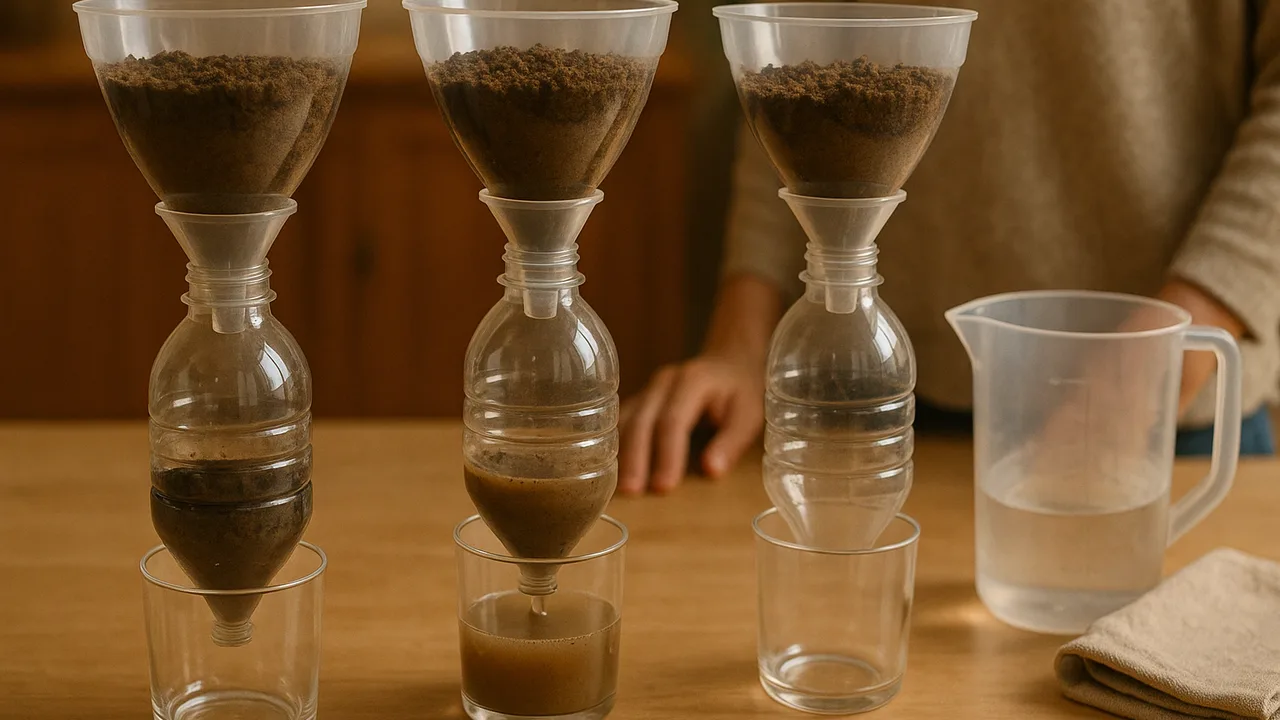
plan a fair erosion test that keeps everything the same but one variable, and measure how much soil the water moves.
- I can explain how the data we collect will help us find cause and effect relationships between weathering or erosion and changes to Earth materials.
- I can describe how we will collect data about the speed of air or water flow.
- I can describe how we will count cycles of freezing and thawing, and the number and types of plants in the Earth material.
- I can describe how we will measure the amount or size of soil, sediment, or rocks moved or broken down by weathering or erosion.
- I can describe which variables we will keep the same, such as water flow, air movement, temperature, and the presence of plants.
Phase 2: Investigate
Warm-Up ~5 min
Do Now. Jamal’s team tested a steep hill with one cup of water. Then they tested a gentle hill with three cups. The gentle hill got muddier. Jamal says, “Gentle hills erode more!”
Is Jamal's conclusion trustworthy?
Instruction ~10 min
Junior engineers, let’s make our test fair. In a fair test, we change only one thing. That one thing is the variable we test. Everything else stays the same. Those are the controlled variables.
A better way to measure. Last time we rated mud by eye. Today we measure it. Catch the runoff in a clear cup. Let it sit for 10 minutes. The soil sinks to the bottom. Then use a ruler to measure how many millimeters of soil settled. More soil means more erosion.
Worked example 1: plant count. Mei’s team tests plant cover. Their variable is the number of sprouts on the hill: 0, 10 and 20. They count the sprouts in each tray. They keep the slope at 2 books. They use one cup of water poured from the same height. They use the same soil. Then they measure settled soil in each cup.
Worked example 2: reading the results. Mei’s cups show 9 mm of soil with 0 sprouts, 5 mm with 10 sprouts and 2 mm with 20 sprouts. More plants went with less soil moved. Because only the plants changed, the plants are the likely cause. That is a cause-and-effect relationship.
Repeat it. Scientists run a test more than once. If the results are close each time, we trust them more.
Guided Exercises ~15 min
Choose ONE variable: slope (1, 2 or 3 books) OR plant cover (0, 10 or 20 sprouts). Fill in the plan first, then run each test twice.
| Our variable | |||
|---|---|---|---|
| We keep the same | |||
| Setting | Trial 1 soil (mm) | Trial 2 soil (mm) | What we noticed |
Independent Practice ~10 min
Use your own data.
Write a cause-and-effect sentence from your data: “When we changed ___, the soil moved ___, so ___ causes ___.”
Which list shows good controlled variables for a plant-cover test?
Closure ~5 min
Now our data is fair and measured. Next lesson, we test a different force on rock: ice.
Exit ticket: name your variable and two things you kept the same. Why does keeping them the same matter?
Teacher notes
Materials (per team): the pan model from 4.03, three seed trays or soil squares with about 0, 10 and 20 sprouts (thin them to count), a measuring cup, 3 clear plastic cups, a ruler with millimeters, a timer, paper towels.
Setup: Prop the pan so its low corner drains into a cup, or scoop the runoff into the cup with a spoon. Let cups settle while teams work through the carousel.
Listen for: teams that change more than one variable, and teams that pour from different heights. The numbers in the worked example are made up for practice; your teams’ data will differ.
Support / stretch: Assign the variable and pre-write the controlled variables for some teams. Stretch: graph both trials as a bar graph.