4.25 Station Launch Day: Presenting to the Green Team
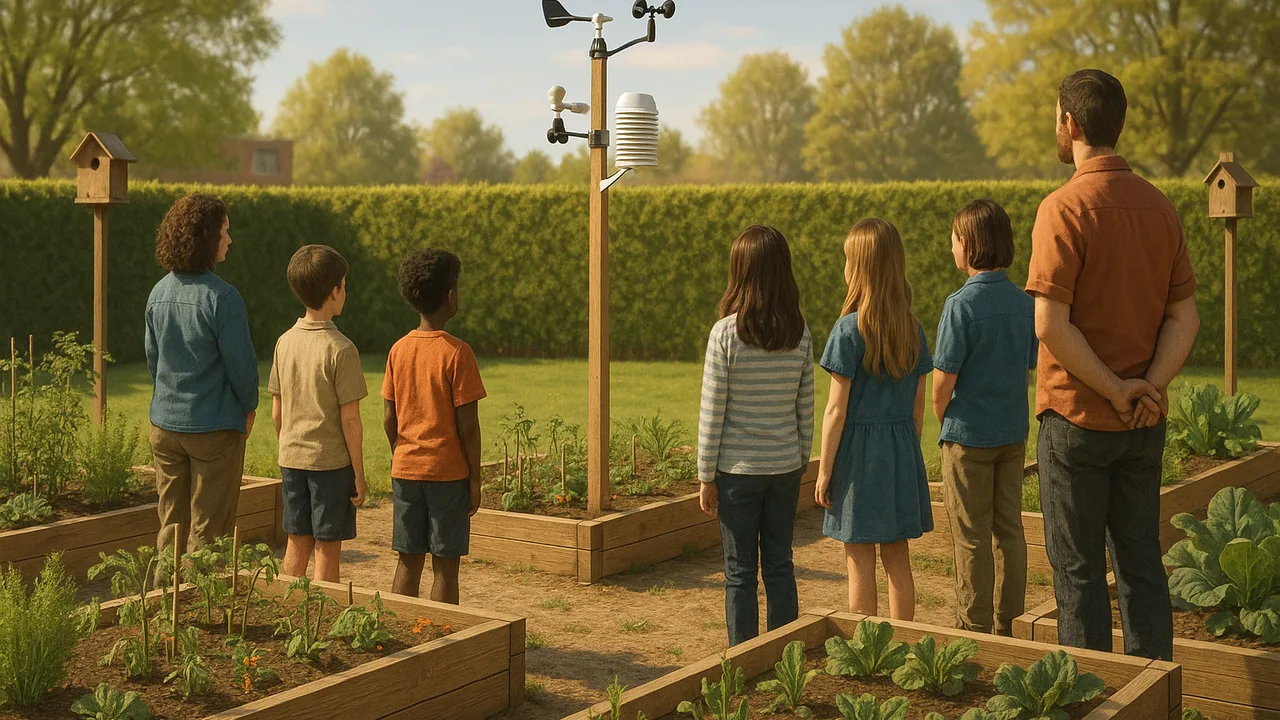
present our weather and wildlife station to the green team and explain the weather, climate and ecosystem science behind it.
- I can use my model to explain how each part—like the ocean, atmosphere, landforms, and energy from the sun—helps create a specific regional climate.
- I can describe how patterns of interactions, like competition, mutual benefit, and predator/prey, are similar across different ecosystems and species.
- I can use my model to describe how energy and atoms move when organisms consume other organisms.
- I can use my model to explain how matter and energy are transferred between living and nonliving parts at every level in the ecosystem.
Phase 5: Prove It — public product
Warm-Up ~5 min
Do Now. Rehearse your 30-second opening with a partner. Start: “Welcome to the Schoolyard Weather and Wildlife Station. Our team built…”
A green team member asks why the station has a brush pile. Which answer is strongest?
Instruction ~10 min
Station engineers, today you are the experts. Each team runs one station table for green team members and guests. You have four minutes to explain your part, show data and answer a question.
Worked example 1: a strong station talk. Jamal: “Our anemometer combines four small cups from one design with the sturdy skewer frame from another. In two weeks it survived every storm. On day 9 it spun fast as the wind shifted to the northwest and the temperature fell 8 degrees. That pattern fits a cold front, so we forecast clearing, cooler weather.” He used design data and weather science together.
Worked example 2: answering a hard question. A guest asks, “Why plan for winter if the birds can fly south?” Mei answers, “Some species do migrate, but chickadees and others stay. Our inland climate gets cold winters because land loses heat quickly, so those birds need high-energy seed and open water then.” She used the climate model to answer.
Guided Exercises ~15 min
Final rehearsal. Every team member must be ready to explain every card.
Independent Practice ~10 min
Write your part of the station talk.
Write the four or five sentences you will say. Include one design decision with data, one weather or climate idea, and one ecosystem idea.
Public product: the Schoolyard Weather and Wildlife Station
Launch the station for the school green team (or guests playing the green team). Your team presents the instruments, a forecast from your station data, and the habitat improvement plan with its food-web model. End with a written recommendation: what the school should keep, change or add next season, and why.
Submission workflow
- Set up the station table: optimized instruments, feature table, two-week data log and graphs.
- Explain how you combined the best features and what the test data showed, including one limitation of your model.
- Give a forecast from your station data, naming the air-mass pattern and using a probability.
- Use the climate model to explain what our region’s seasons mean for schoolyard wildlife.
- Present the habitat plan with its food web: resources, interactions, energy flow and matter cycling.
- Hand the green team a written recommendation and answer one question with evidence.
How it is scored
| Criterion | What proficient looks like |
|---|---|
| Weather and climate | Uses station data to explain how moving air masses change the weather, gives a probability forecast, and uses a model to explain the regional climate. |
| Ecosystem science | Explains how resources limit populations, names competition, predation and mutualism, and traces energy flow and matter cycling with a model. |
| Design and data | Shows test data from several designs, explains which features were combined and why, and describes a model limitation and a data-based revision. |
| Communication | Presents clearly to the client, every member speaks, answers a question with evidence, and gives a useful written recommendation. |
Closure ~5 min
Your station now belongs to the school. Next class is the unit checkpoint, then two catch-up and stretch lessons.
Exit ticket: what question from the green team surprised you? How did you answer it, and what evidence did you use?
Teacher notes
Materials: each team’s instruments, feature tables, graphs, habitat plan and food web, printed rubric, recommendation template, timer, name tents.
Setup: Invite green team members, a custodian or facilities staff, and an administrator. If they cannot attend, invite another class to play the client. Give 10 minutes to set up and rehearse.
Listen for: “energy is recycled”; “forecasts are guesses”; claims with no numbers.
Support / stretch: Give a station script with blanks. Stretch: ask teams to explain how a warmer climate could change which species visit the schoolyard.