4.22 Who Lives Here? Resources, Populations and Bird Counts
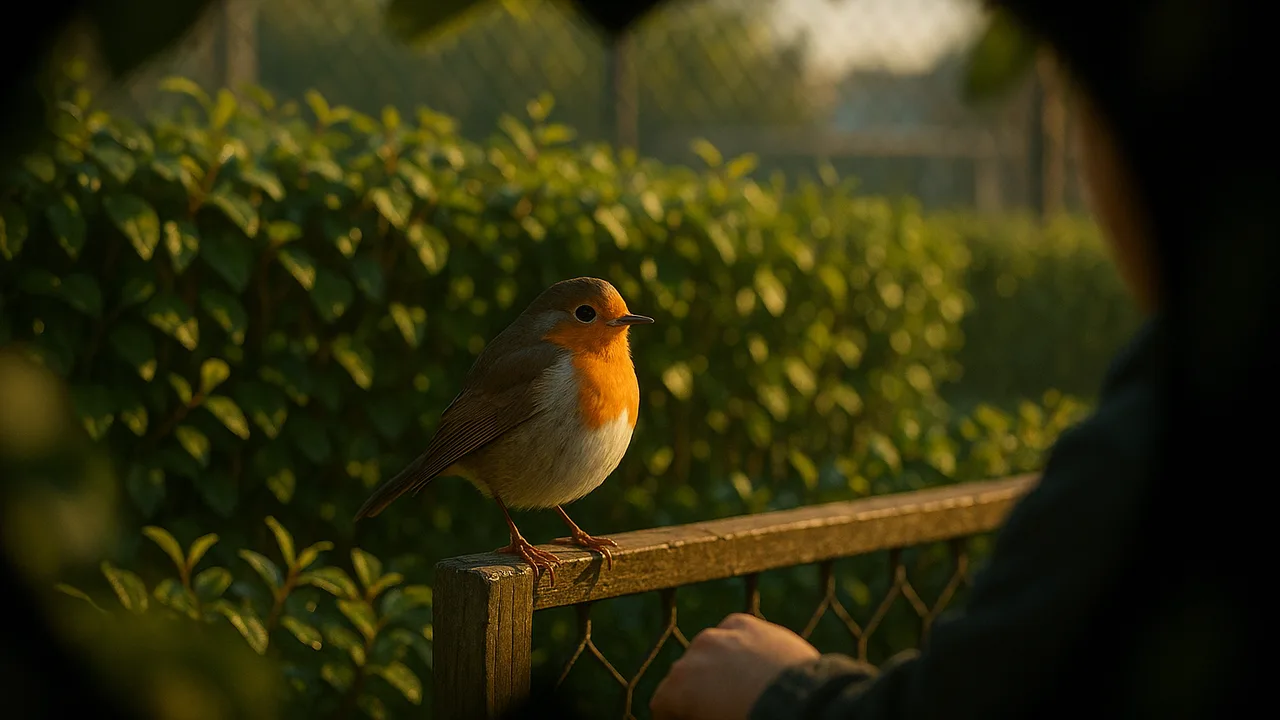
use population data to explain how food, water and shelter affect schoolyard wildlife, and identify the interactions our habitat plan must expect.
- I can analyze organized data to figure out how the size of a population and the growth or survival of individual organisms are affected by the amount of resources available.
- I can use evidence from data to predict how changes in resource availability might affect the size of a population.
- I can use evidence from data to predict how changes in resource availability might affect the growth of individual organisms.
- I can use evidence from data to predict how resource availability can lead to competition among organisms and affect a population’s reproduction rate.
- I can describe evidence showing that organisms compete for resources in an ecosystem, such as changes in population when a competing species is introduced.
- I can identify evidence of predatory and mutually beneficial interactions among organisms, including examples where organisms depend on each other to survive.
- I can explain how resource availability affects interactions, and show that competitive, predatory, and mutually beneficial interactions happen in different ecosystems.
Phase 4: Build
Warm-Up ~5 min
Do Now. Remember the pond from our phenomenon: crowded with frogs some years, nearly empty in others. Write one resource that might explain the difference.
A spring is very dry, and the pond shrinks early. What will most likely happen to the number of tadpoles that become frogs?
Instruction ~10 min
Station engineers, a habitat plan starts with the populations it serves. A population is all the members of one species in an area. Every population needs food, water, shelter and space. When a resource is plentiful, more individuals survive and reproduce, and individuals often grow bigger. When it is scarce, populations shrink and individuals compete.
Worked example 1: feeder data. Jamal’s class counts birds at a test feeder for 10 minutes each morning.
| Week | Feeder filled? | Mean chickadees | Mean sparrows | Chases seen |
|---|---|---|---|---|
| 1 | full daily | 6 | 9 | 4 |
| 2 | half the days | 3 | 8 | 11 |
| 3 | full daily | 7 | 10 | 5 |
(Sample class data.) When food was scarce in week 2, chickadee visits dropped and chases rose. Is that cause and effect? It repeated when food returned in week 3, which makes the link stronger. But other causes, like a cold snap, should be checked against the station’s weather log.
Worked example 2: three kinds of interactions. Competition: sparrows and chickadees compete for the same seeds. Predation: a hawk hunting near a feeder eats small birds. Mutualism: bees drink nectar from native flowers and carry pollen between them, so both benefit. These same three patterns appear in forests, oceans and deserts, with different species.
Guided Exercises ~15 min
Run a 10-minute wildlife count in the schoolyard. Use the same spot and time each day this week.
| Species | Count | Resource it was using | Interaction seen |
|---|---|---|---|
Independent Practice ~10 min
Predict like an ecologist.
Predict what will happen to the chickadee population if the schoolyard adds native shrubs with winter berries. Explain your prediction with data and the idea of resources.
Compare your class count with one data set from a citizen-science project. Do the two sources agree? Why does using more than one source make evidence more reliable?
🔎 Mini case study: Counting birds and rain for science ~7 min
For more than a century, volunteers have helped scientists track bird populations. The Audubon Christmas Bird Count began in 1900. Each winter, volunteers count every bird they see in a set circle on one day. The Great Backyard Bird Count, run by the Cornell Lab of Ornithology and Audubon, asks people to count birds for a few days each February from anywhere, even a backyard feeder. Because counts happen the same way year after year, scientists can compare them over time.
Scientists use these records to spot which species are rising or falling, and how bird ranges shift as habitats and climate change. Weather has volunteer observers too. In the CoCoRaHS network, volunteers measure rain and snow with standard gauges every morning, and forecasters and researchers use the reports. Many small, careful counts add up to data no single scientist could collect.
Think about it: Why do these projects ask every volunteer to follow the same method? What could go wrong with the data if each person counted their own way?
Closure ~5 min
You now know who lives here and what limits them. Next class you design the habitat plan and trace energy and matter through it.
Exit ticket: name one resource that limits a schoolyard population. Cite one piece of data that supports your claim.
Teacher notes
Materials: clipboards, count sheets, a simple field guide or bird ID chart, binoculars if available, a test feeder with seed, graph paper.
Setup: Check the school’s policy on feeders before you hang one. Pick a quiet count spot visible from a door. Pull one public data set from a citizen-science bird project for your county ahead of time.
Boundary note: keep LS2-2 on patterns of interactions; no population equations.
Listen for: “animals choose to share”; treating one week’s change as proof. Ask for repeated patterns.
Support / stretch: Give a picture ID card for six common species. Stretch: calculate the percent drop in chickadee visits in week 2.