4.04 Fronts on the Map: When Air Masses Meet
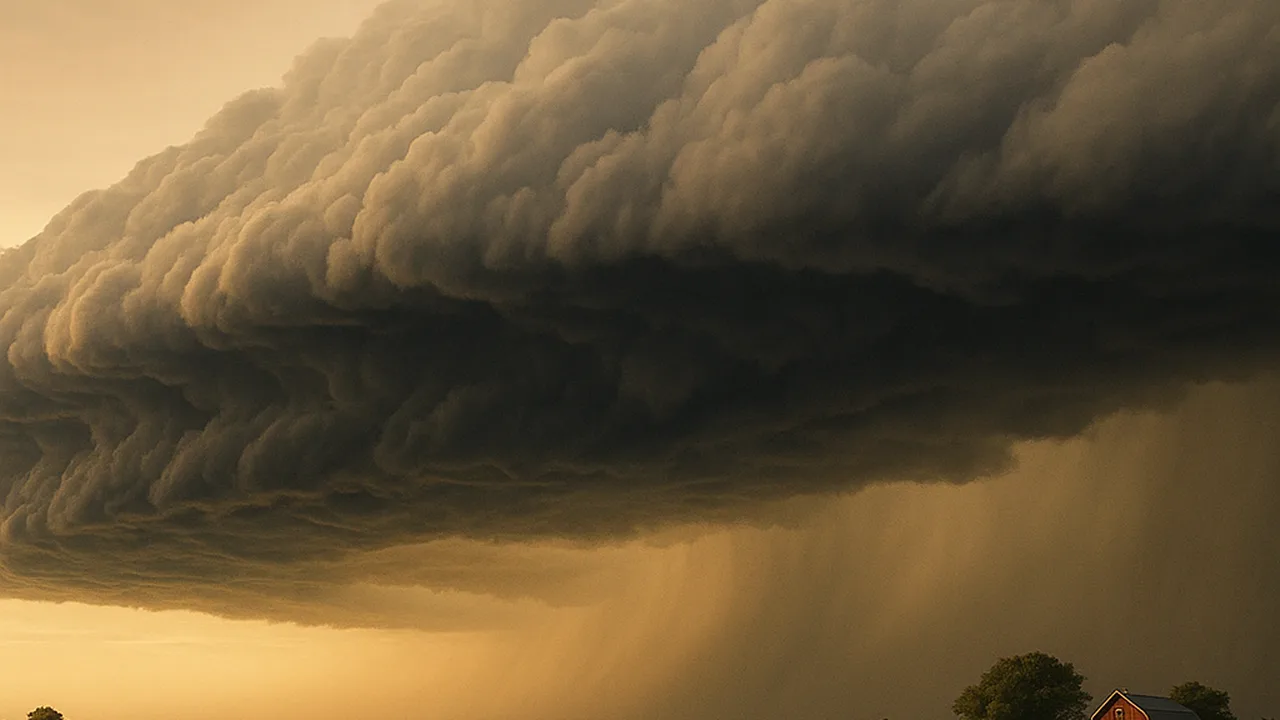
model how cold and warm air masses interact, and use a weather map and a station log to connect a passing front with changes in our weather.
- I can describe what data to collect to show patterns in weather conditions (like temperature, air pressure, humidity, and wind speed) over time in one area.
- I can explain how the movement and location of air masses relate to landforms, ocean temperatures, and currents.
- I can describe how large-scale weather patterns, such as storms or fronts, are related to where air masses are and how they move.
- I can describe how the movement and interactions of air masses cause changes in weather conditions.
Phase 2: Investigate
Warm-Up ~5 min
Do Now. Your teacher has a clear tub with a removable divider. One side holds cold blue water. The other holds warm red water. Before the divider is lifted, make a prediction.
What will the colored water do when the divider is lifted?
Instruction ~10 min
Explore first: the front tank. Each team repeats the divider model in a clear plastic box. The Tester lifts the divider slowly. The Recorder sketches the boundary between colors at 5, 15 and 30 seconds. Then the team swaps roles and repeats once.
| Time | Sketch of the color boundary | Which water is on the bottom? | Which water moved up? | How this matches air at a front |
|---|---|---|---|---|
| 5 s | ||||
| 15 s | ||||
| 30 s |
Now we name it. The boundary where two air masses meet is called a front. At a cold front, colder air pushes into warmer air. The dense cold air wedges under the warm air and lifts it quickly. If the warm air is humid, the rising air cools, and water vapor condenses into tall clouds. Thunderstorms often form along cold fronts. At a warm front, warm air slides up and over colder air more gently. That often brings wide, layered clouds and steadier rain.
Worked example 1: reading a weather map. A weather map shows where air masses and fronts are. Each map comes with a key, so you never need to memorize symbols. On our sample map, a cold front stretches across the region to our west and moves east toward our town. Behind it is cool, dry air from Canada. Ahead of it is warm, humid air that came north from the Gulf of Mexico. The front is the edge between them.
Worked example 2: matching the map to a station log. Here is a sample log from a school station as that front passed.
| Time | Temp (°F) | Pressure (hPa) | Humidity (%) | Wind from | Sky |
|---|---|---|---|---|---|
| 11 a.m. | 84 | 1012 | 70 | Southwest | Hazy sun |
| 2 p.m. | 86 | 1008 | 72 | Southwest | Tall clouds |
| 4 p.m. | 72 | 1007 | 90 | West | Thunderstorm |
| 7 p.m. | 68 | 1013 | 55 | Northwest | Clearing |
Pressure fell as the front approached and rose after it passed. The temperature dropped sharply. The wind swung from southwest to northwest. After the storm, the air was drier. Every change points to the same cause: the cold, dry air mass replaced the warm, humid one. These are sample numbers that show a typical pattern.
Guided Exercises ~15 min
Use your front tank sketches and the sample station log.
Independent Practice ~10 min
Connect the model to the real sky.
Draw a side view of a cold front. Label the cold air mass, the warm air mass, the front, the direction each moves, and where clouds form.
Look at our own class log. Did any day show a pattern like the sample, with pressure falling and the wind shifting? Describe it.
Closure ~5 min
Fronts are where air masses meet, and those meetings change our weather. Next time we ask why air masses differ in the first place, starting with how land and water heat up.
Exit ticket: name three changes you would expect at our station when a cold front passes, and explain the cause of one of them.
Teacher notes
Materials: per team, a clear plastic shoebox with a cardboard or plastic divider, warm and cold tap water, red and blue food coloring, a timer. One printed weather map with fronts and a key (a current NWS surface map works).
Setup: chill the cold water with ice beforehand and remove the ice before pouring. Fill both sides to the same level before lifting the divider.
Listen for: “cold air rises because it is lighter” (cold air is denser and sinks). “The front is a line of clouds” (the front is the boundary between air masses; clouds may form along it). The MS-ESS2-5 boundary means students use provided maps and keys, not memorized symbols or cloud names.
Support / stretch: give a partly labeled cold front diagram. Stretch: have teams compare a cold front and a warm front in a two-column chart.