3.10 Reading the Seafloor: Ridges, Trenches and Rock Ages
analyze seafloor features and crust-age data to find patterns that show new seafloor forms at mid-ocean ridges and continents move apart.
- I can analyze the data to find patterns and relationships, such as how the age of seafloor changes from the center to the edges of oceans or how similar fossils and rocks are found on different continents.
- I can use the data to explain how continents that share similar fossils and rocks were once connected and have moved apart.
- I can use the shapes of continents to show how they fit together like puzzle pieces, suggesting they were once joined.
- I can use patterns in the ages of oceanic crust to show how new seafloor forms at the center of oceans and gets older toward the edges.
Phase 3: Make Sense
Warm-Up ~5 min
Do Now. If the ocean floor were drained, what would it look like? Flat like a bathtub, or full of mountains and canyons? Sketch your guess.
Where in an ocean would you expect to find the YOUNGEST seafloor rock?
Instruction ~10 min
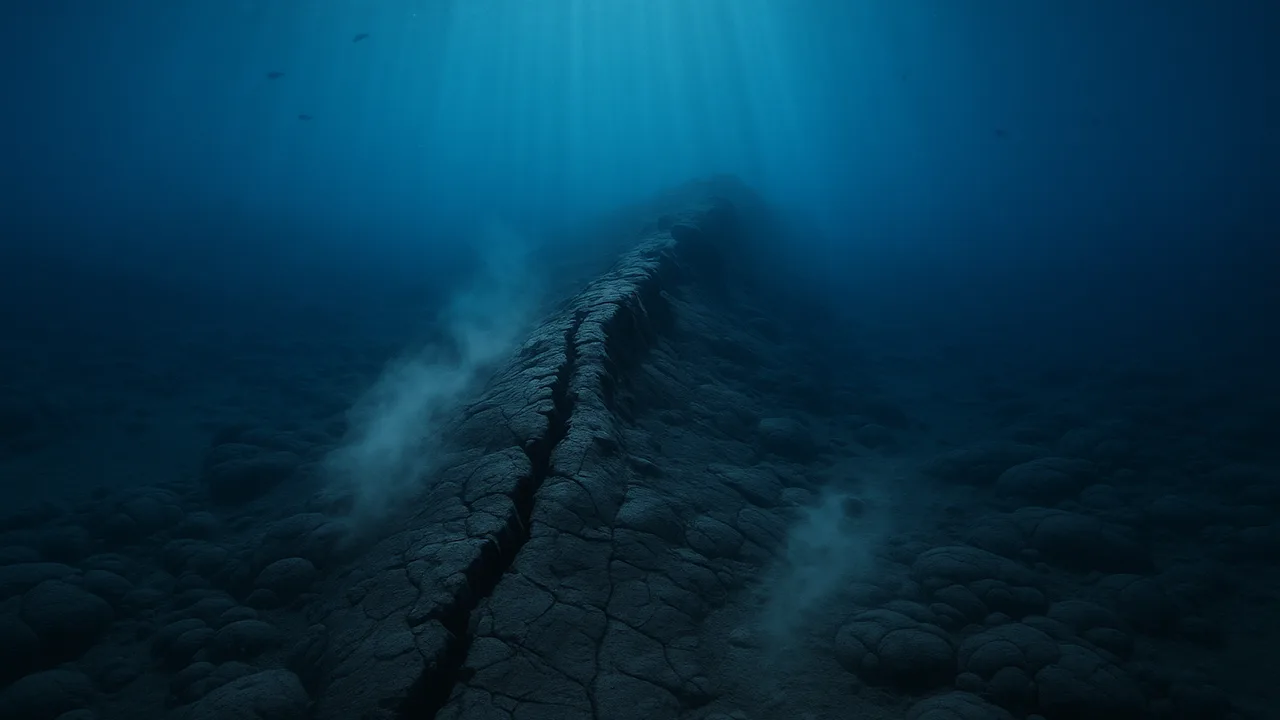
Trail geologists, the seafloor holds a hidden map. In the 1900s, ships used sound echoes to map the ocean floor. They found a chain of underwater mountains running down the middle of the Atlantic Ocean, called the Mid-Atlantic Ridge. A deep valley splits its center. Along some ocean edges, they found deep trenches.
Rock ages. Seafloor rock is igneous rock that formed from cooled lava. Its age can be measured. Two well-documented patterns stand out. First, rock at mid-ocean ridges is youngest and gets older with distance on both sides. Second, even the oldest seafloor is less than about 200 million years old, while some continental rock is billions of years old.
Worked example 1: graphing practice data. Our table is practice data for a model ocean, shaped like the real pattern. Priya plots distance from the ridge on the x-axis and age on the y-axis. Points on both sides rise in straight lines, like a V. The farther from the ridge, the older the rock.
Worked example 2: finding a rate. In the practice data, rock 200 km from the ridge is 10 million years old. Diego divides: 200 km ÷ 10 million years = 20 km per million years. That equals about 2 cm per year, close to how fast fingernails grow. Slow, but over millions of years it opens an ocean.
Putting it together. New seafloor forms at the ridge and moves away on both sides, so the continents on either side move apart. This matches the fossil and puzzle evidence from 3.08.
Guided Exercises ~15 min
PRACTICE data for a model ocean (not real measurements). Graph age against distance from the ridge for both sides.
| Distance from ridge (km) | West side age (million years) | East side age (million years) |
|---|---|---|
| 0 | 0 | 0 |
| 200 | 10 | 10 |
| 400 | 20 | 20 |
| 600 | 30 | 30 |
| 800 | 40 | 40 |
Write your notes in this table as you analyze.
| Pattern we see | What it tells us |
|---|---|
Independent Practice ~10 min
Formative check: organizing plate evidence.
Make a four-row table: shapes, fossils, rocks, seafloor ages. In each row, write what the data shows and how it supports the claim that continents moved.
Closure ~5 min
The seafloor itself records continents moving apart. Next lesson, we combine rocks, energy and time into one model of how ocean fossils reached the ridge.
How confident are you that you can I can use seafloor age patterns as evidence that plates move.
Exit ticket: explain what the V-shaped pattern of seafloor ages tells us about where new seafloor forms.
Teacher notes
Materials: graph paper, rulers, colored pencils, a printed or projected seafloor age map from a reliable source such as NOAA (preview it), student 3.08 evidence tables.
Timing (50 min): Do Now 4, mini-lecture 10, graphing 12, guided questions 12, formative table and exit 12.
Listen for: confusion between the practice data and real measurements; say clearly that the numbers are a model. Stay inside the MS-ESS2-3 boundary: no mantle convection. The independent table is a formative check of MS-ESS2-3:1a and 1b.
Support / stretch: Provide pre-labeled axes. Stretch: on a real age map, find where seafloor is oldest and describe the pattern.