4.19 Gallery Critique: Think Like a Meteorologist
give and use peer feedback to revise my instrument, and explain why weather forecasts are stated as probabilities.
- I can describe why weather predictions are based on probability because weather patterns are complex and have many causes.
- I can describe how the data from my model, along with the criteria and constraints, can help me improve my design through testing and making changes.
- I can explain how each part of my proposed solution affects how it works.
- I can describe how my proposed solution connects to the problem I am trying to solve.
- I can explain how each part of my proposed solution relates to the problem and how the data from my model shows how well the solution works.
Phase 4: Build — critique and revision
Warm-Up ~5 min
Do Now. Tonight’s forecast says “60% chance of rain.” Malik says that means it will rain for 60% of the day. Is he right?
What does a 60% chance of rain mean?
Instruction ~10 min
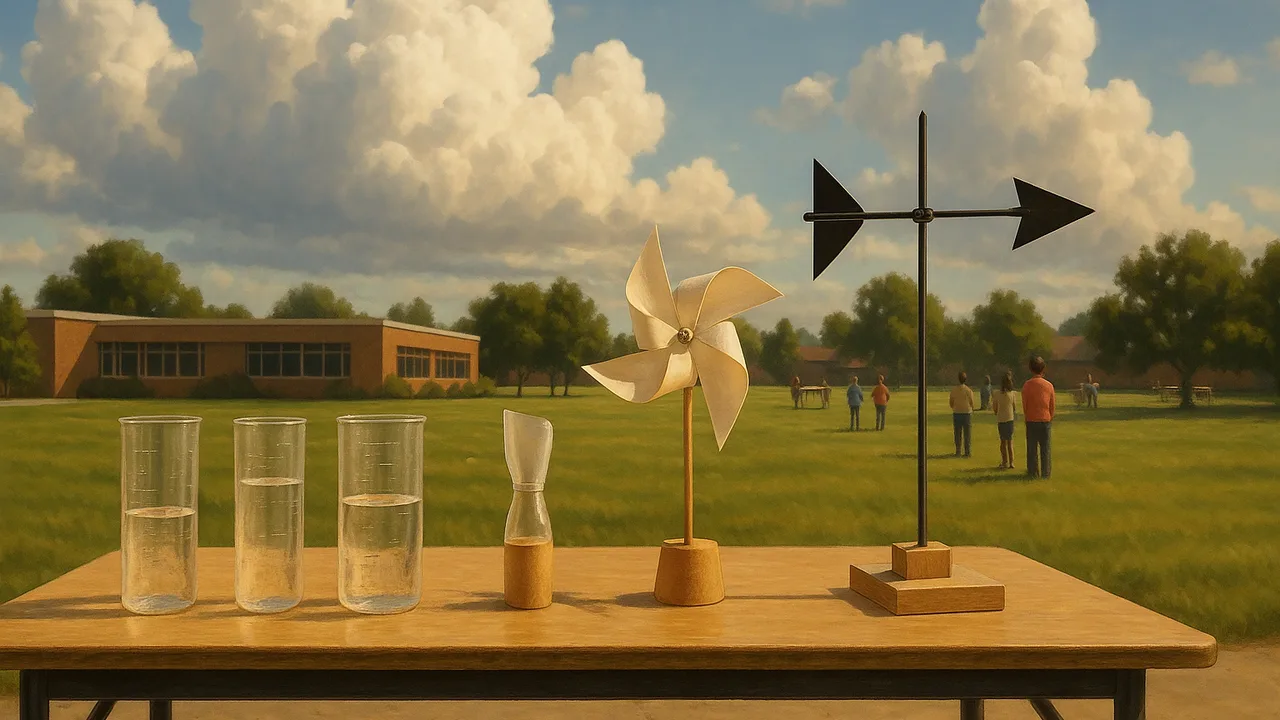
Station engineers, today your work gets critiqued. Each team sets out its optimized instrument with its data tables. Visitors use the protocol I like… I wonder… What if… on sticky notes. Feedback must point to the criteria or the data, not just say “cool.”
Worked example 1: useful feedback. Weak: “I like it.” Strong: “I like that your anemometer spun 34 times on high. I wonder whether it still turns in a light breeze. What if you tested it at the fan’s lowest setting from farther away?” The strong note names data and suggests a test.
Worked example 2: from data to a forecast. Priya’s team logs three changes. Pressure falls for a day. The wind shifts from the south to the west. Clouds thicken. These match the pattern of a cold front arriving, as a cooler air mass pushes in. They forecast “rain likely tonight, then cooler.” They say “likely,” because a front can slow down, speed up or weaken.
Why probability? Weather depends on many things at once: air masses, moisture, the Sun’s heating, landforms and the ocean. A small change in one can change the outcome. So forecasts use patterns from past data and give a chance, not a certainty.
Guided Exercises ~15 min
Gallery walk: visit three other stations. Leave one note of each kind. Then return and sort the notes you received.
| Feedback we received | Criterion it connects to | Our revision plan |
|---|---|---|
Independent Practice ~10 min
Write a forecast like a meteorologist.
Use this data: pressure rising, wind from the northwest, temperature dropping. Write a one-day forecast with a probability word or percent. Explain which data supports it.
Closure ~5 min
Critique made your instruments stronger. Next class is the mid-build checkpoint on instruments, weather and design.
Exit ticket: what revision did you make today, and what data shows whether it helped?
Teacher notes
Materials: optimized instruments and data tables, sticky notes in three colors (I like / I wonder / What if), feedback sort sheet, a printed recent forecast with percent chances.
Setup: Model one strong and one weak note before the walk. Give 6 minutes per station. Leave 15 minutes for revision and a quick retest.
Listen for: “a 60% chance means rain 60% of the day”; “forecasts are just guesses.” Stress that forecasts come from data and patterns.
Support / stretch: Give feedback sentence stems. Stretch: keep a tally of class forecasts vs. what happened over the next two weeks, and calculate a hit rate.