4.08 Who Eats, Who Helps, Who Competes?
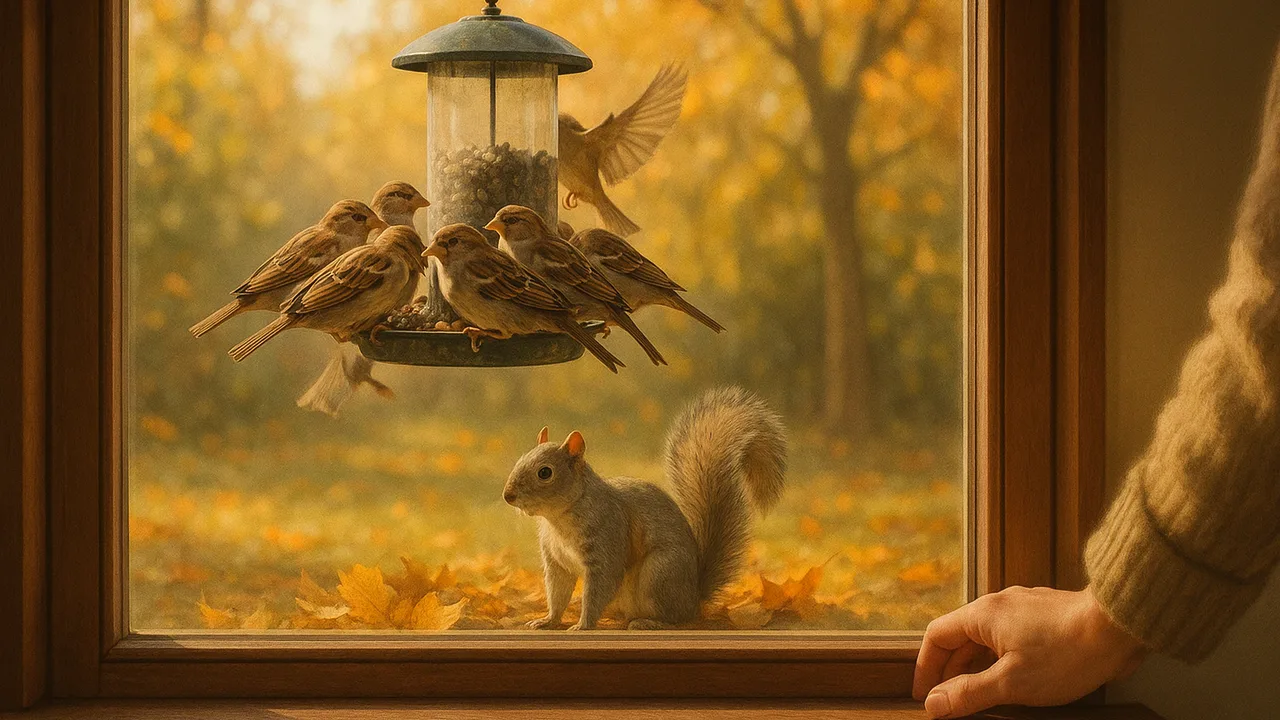
observe and tally interactions in our schoolyard, gather evidence from several sources, and sort interactions into competition, predation and mutualism.
- I can describe evidence showing that organisms compete for resources in an ecosystem, such as changes in population when a competing species is introduced.
- I can identify evidence of predatory and mutually beneficial interactions among organisms, including examples where organisms depend on each other to survive.
- I can explain how resource availability affects interactions, and show that competitive, predatory, and mutually beneficial interactions happen in different ecosystems.
- I can use multiple valid and reliable sources to gather evidence about interactions among organisms.
- I can identify and describe patterns—using numbers or descriptions—in how organisms interact, to help find cause-and-effect relationships in ecosystems.
Phase 2: Investigate
Warm-Up ~5 min
Do Now. A squirrel chases a blue jay off a bird feeder. A bee crawls into a flower and comes out dusted with pollen. A hawk dives toward a mouse. Which of these interactions helps both living things?
Which interaction helps BOTH organisms?
Instruction ~10 min
Explore first: the schoolyard survey. Each team takes a 15-minute survey at one zone: the feeder, the garden, the tree line or the wet corner. Watch quietly from at least 3 meters away. Each time you see two organisms interact, make a tally and describe it in a few words. Do not name the type of interaction yet.
| Organisms involved | What happened | Tally | Who benefits? Who is harmed? | Type (fill in later) |
|---|---|---|---|---|
Now we name it. Back inside, teams look at the “Who benefits?” column. Three patterns appear again and again. In competition, two organisms try to use the same limited resource, and both can lose some. In predation, one organism, the predator, eats another, the prey. In mutualism, both organisms benefit.
Worked example 1: a tally pattern. Mei’s team watched the feeder. They counted 14 times when squirrels or larger birds pushed smaller birds away. When the feeder was refilled, they counted only 3. When food was scarce, competition happened more often. This is sample data, but it shows how numbers can reveal a cause-and-effect pattern.
Worked example 2: checking more than one source. Jamal’s team saw ants climbing up a plant stem crowded with tiny green insects called aphids. Was it predation? They checked three sources: a field guide, a university extension website and their own close-up photos. All three agreed. Many ants protect aphids and in return eat a sugary liquid the aphids make. That is mutualism. Using several reliable sources made their claim stronger than one observation alone.
Reliable sources. Good sources include field guides, science museums, nature centers, government wildlife agencies and university websites. Ask who wrote it, how they know, and whether other sources agree.
Guided Exercises ~15 min
Sort the interactions you observed and the ones below.
Independent Practice ~10 min
Finish your survey table.
Fill in the Type column for every row in your survey table. Then count how many of each type your team saw. Which type was most common in your zone, and why might that be?
Closure ~5 min
Our schoolyard is full of competition, predation and mutualism. Next time we follow what happens to matter and energy when organisms eat, die and decay.
Exit ticket: give one example each of competition, predation and mutualism, and say who benefits in each.
Teacher notes
Materials: clipboards, survey tables, a timer, hand lenses, a printed regional field guide or a few pages from one, devices for checking a university extension or state wildlife site. Binoculars if available.
Setup: fill the feeder a day ahead so birds are active. If weather or season keeps wildlife away, use a short nature video or photo set and keep the same table.
Listen for: “predators are bad and prey are good”; all three interactions are normal parts of ecosystems. Some students will label eating a plant as “not an interaction”; herbivory is a feeding interaction, like predation, for our sorting.
Support / stretch: give a picture sort card set before the survey. Stretch: find an interaction where one organism benefits and the other is barely affected, and argue where it fits.