4.16 Rain Gauge Trials: Three Designs, One Test
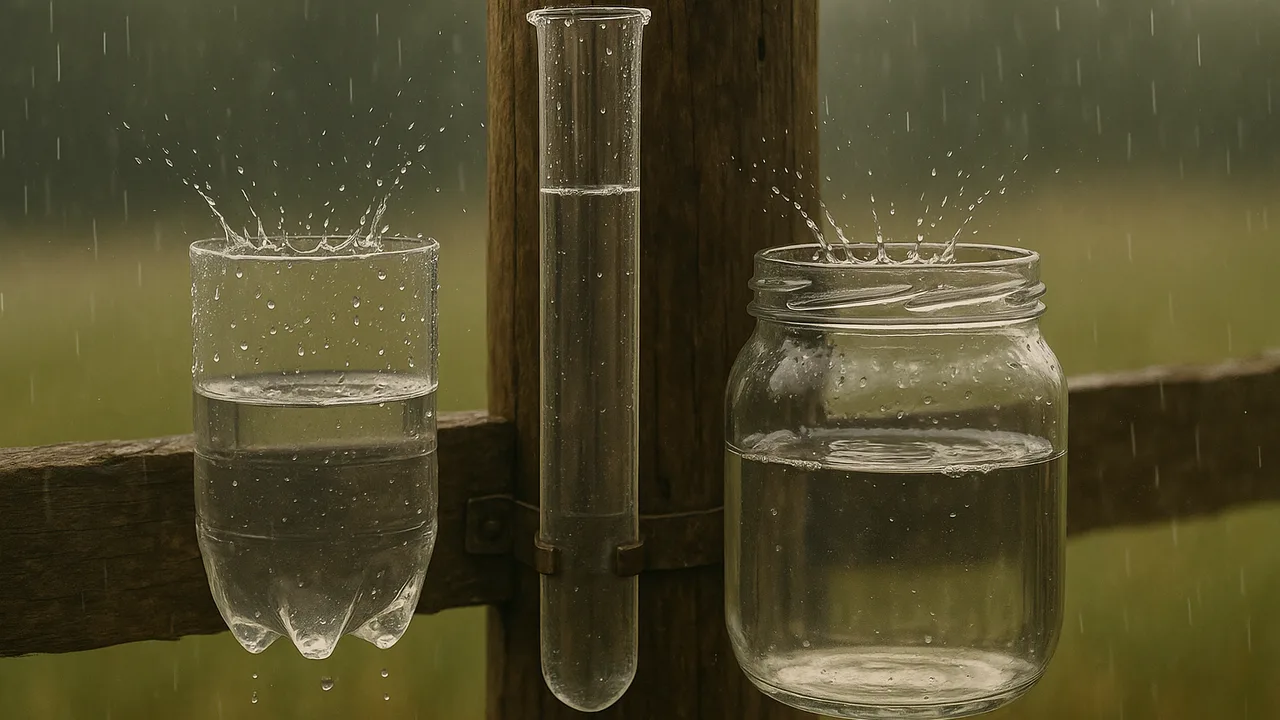
build three rain gauge designs, test them against a reference gauge, and organize the results in a data table and a bar graph.
- I can organize data from tests of three or more design solutions using tables, charts, or graphs.
- I can analyze data using methods like comparing numbers or looking for patterns.
- I can identify how each design solution meets the criteria and fits the constraints by examining the data.
- I can make observations and record weather data myself or use information from professional weather monitoring services.
Phase 4: Build
Warm-Up ~5 min
Do Now. Diego says a wide bucket will catch “more rain” than a narrow jar, so it will show a bigger rainfall reading. Do you agree?
Rain falls evenly on a wide bucket and a narrow jar, both with straight sides. How will their water DEPTHS compare?
Instruction ~10 min
Station engineers, today you test like scientists. Each team builds three rain gauge designs. Then every gauge gets the same “rain storm” from a watering can, so the only thing that changes is the design.
The three designs. Design A is a straight-sided can with a ruler taped inside. Design B is a cut plastic bottle with its top flipped in as a funnel. Design C is a narrow jar under a wide funnel, which makes small rainfalls easier to read but needs calibration. A straight-sided reference gauge sits beside them as the “true” value.
Worked example 1: organizing data. Priya’s team runs three trials and records each reading in millimeters.
| Design | Trial 1 (mm) | Trial 2 (mm) | Trial 3 (mm) | Mean (mm) | Error vs. reference (mm) |
|---|---|---|---|---|---|
| Reference | 12 | 12 | 12 | 12 | 0 |
| A: straight can | 12 | 11 | 12 | 11.7 | 0.3 |
| B: bottle funnel | 15 | 16 | 15 | 15.3 | 3.3 |
| C: funnel + jar | 13 | 12 | 12 | 12.3 | 0.3 |
(These are sample class numbers, not official data.)
Worked example 2: reading the pattern. The mean error shows that A and C both meet the 2 mm criterion. B misses it. Why? The bottle’s curved bottom makes the water rise faster than true depth. Ava suggests a fix: fill the curved bottom with clay, then start the ruler at the flat part. Data pointed to the problem, and the problem pointed to the fix.
Guided Exercises ~15 min
Run the rain test. Pour the same measured amount of water from the same height for the same time over all four gauges. The Tester pours, the Recorder fills the table, and everyone reads the depth at eye level.
| Design | Trial 1 (mm) | Trial 2 (mm) | Trial 3 (mm) | Mean (mm) | Error (mm) | Meets 2 mm criterion? |
|---|---|---|---|---|---|---|
| Reference | ||||||
| A | ||||||
| B | ||||||
| C |
Independent Practice ~10 min
Connect the instrument to real weather data.
Explain how a rain gauge helps us learn about air masses. Hint: what weather often arrives when a warm, moist air mass meets a cold one?
Professional weather services also report rainfall. Describe how you could use their report to check your gauge after a real storm.
Closure ~5 min
Your table and graph are evidence. Next class you test wind and pressure instruments and start comparing features across designs.
Exit ticket: which rain gauge design met the criterion best? Cite one number from your data table.
Teacher notes
Materials: straight-sided cans, 2-liter bottles (pre-cut), narrow jars, funnels, rulers in mm, clear tape, clay, watering cans or cups with pin-holes, measuring cups, a tray or tub under the test area, towels.
Setup: Test over a tub or outdoors. Mark a pour height with tape. Keep one class reference gauge so every team compares to the same standard.
Listen for: “bigger container, more rain”; mixing up volume and depth; reading the ruler from above instead of at eye level.
Support / stretch: Provide a mean calculator strip. Stretch: for Design C, work out the calibration ratio from the funnel’s width and the jar’s width, then compare it to the measured readings.