4.03 Weather Watchers: Starting a Data Log
measure and record temperature, air pressure, humidity, wind and precipitation, compare them with a professional weather service, and list our station’s criteria and constraints.
- I can make observations and record weather data myself or use information from professional weather monitoring services.
- I can describe the tools and methods used in an investigation and explain how they help us learn about changes in weather caused by air masses.
- I can explain how the data I collect will help me find out how air mass activity is connected to changes in weather conditions.
Phase 2: Investigate
Warm-Up ~5 min
Do Now. Today you explore first, and we name the ideas afterward. Step to the window. Without any tools, estimate today’s temperature, the wind direction and how humid it feels. Write your three guesses down.
How close will your guesses be to the readings from our instruments?
Instruction ~10 min
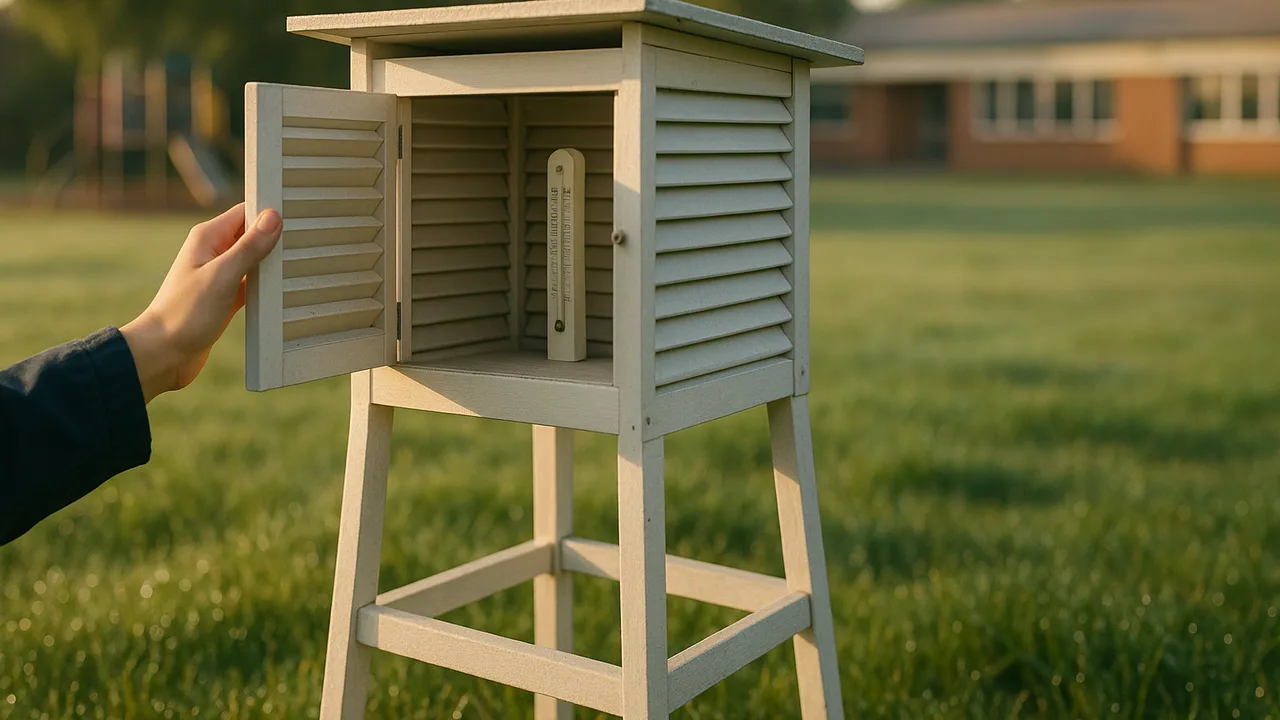
Weather watchers, today you start the station’s data log. Each team visits five stations outside or by an open window. Take readings at the same spot and the same time each day. Keep the thermometer in the shade, about 1.5 meters above the ground, so the Sun does not heat it directly.
- Temperature: a thermometer in the shade.
- Air pressure: a classroom barometer or a phone app, in hectopascals (hPa).
- Humidity: a hygrometer, as a percent.
- Wind: a streamer or wind vane for direction, and a 0–3 scale for strength (calm, light, breezy, strong).
- Precipitation: a clear rain gauge, in millimeters.
Then the Recorder opens the National Weather Service report for our area and copies the same readings. Comparing our data with a professional service is a check on our tools.
| Date and time | Temperature (°F) | Air pressure (hPa) | Humidity (%) | Wind direction and strength (0–3) | Precipitation (mm) | Sky | NWS temperature and pressure |
|---|---|---|---|---|---|---|---|
| Day 1 | |||||||
| Day 2 | |||||||
| Day 3 | |||||||
| Day 4 | |||||||
| Day 5 |
Worked example 1: a tool check. Mei’s team read 78°F on their thermometer, but the weather service reported 72°F. They noticed the thermometer sat on a sunny brick wall. They moved it into the shade and it read 73°F. Comparing with a professional source helped them find an error in their method, not just in their number. These are sample numbers.
Worked example 2: why each measurement matters. Diego asked why we bother with pressure if we cannot feel it. Here is the reason. Each air mass carries its own temperature and moisture, and pressure often falls as a storm system approaches. A log of all five conditions lets us see several changes happening at once. One reading alone cannot show an air mass arriving.
Define the problem. Engineers list criteria, what a design must do, and constraints, the limits it must stay within. Draft criteria: the station measures at least four weather conditions, records them daily, and offers at least one feature that helps wildlife get food, water or shelter. Draft constraints: low cost, safe for students and animals, approved by the green team, and ready before the end of the unit.
Guided Exercises ~15 min
Use your team’s first readings and the weather service report. The Recorder reads the numbers aloud.
Independent Practice ~10 min
Write your own data plan and a first draft of the station’s rules.
Record today's readings in the data table. Then compare one of your readings with the weather service. How close were you, and what could explain any difference?
List two criteria and two constraints for our station. Star the one you think will be hardest to meet.
Closure ~5 min
Our log has begun. Keep adding readings every day this unit. Next time we read weather maps to see where the air masses are.
Exit ticket: name one weather condition you measured today, the tool you used, and why that measurement helps track air masses.
Teacher notes
Materials: 5 station kits (shaded thermometer, barometer or phone app, hygrometer, wind streamer or vane, clear rain gauge), clipboards, a device to open the National Weather Service forecast page for your ZIP code.
Setup: mount the rain gauge away from roofs and trees. If you lack barometers, use one phone app or the NWS pressure reading for everyone and say so in the log.
Listen for: “humidity is the same as rain” (humid air holds invisible water vapor, which may never fall). “High pressure means storms” is a common reversal; falling pressure is more often linked to approaching storms. Keep the log going daily so 4.10 has real local data.
Support / stretch: give a pre-labeled table and a tool picture card. Stretch: ask students to graph temperature and pressure on the same time axis.