4.17 Wind and Pressure Trials
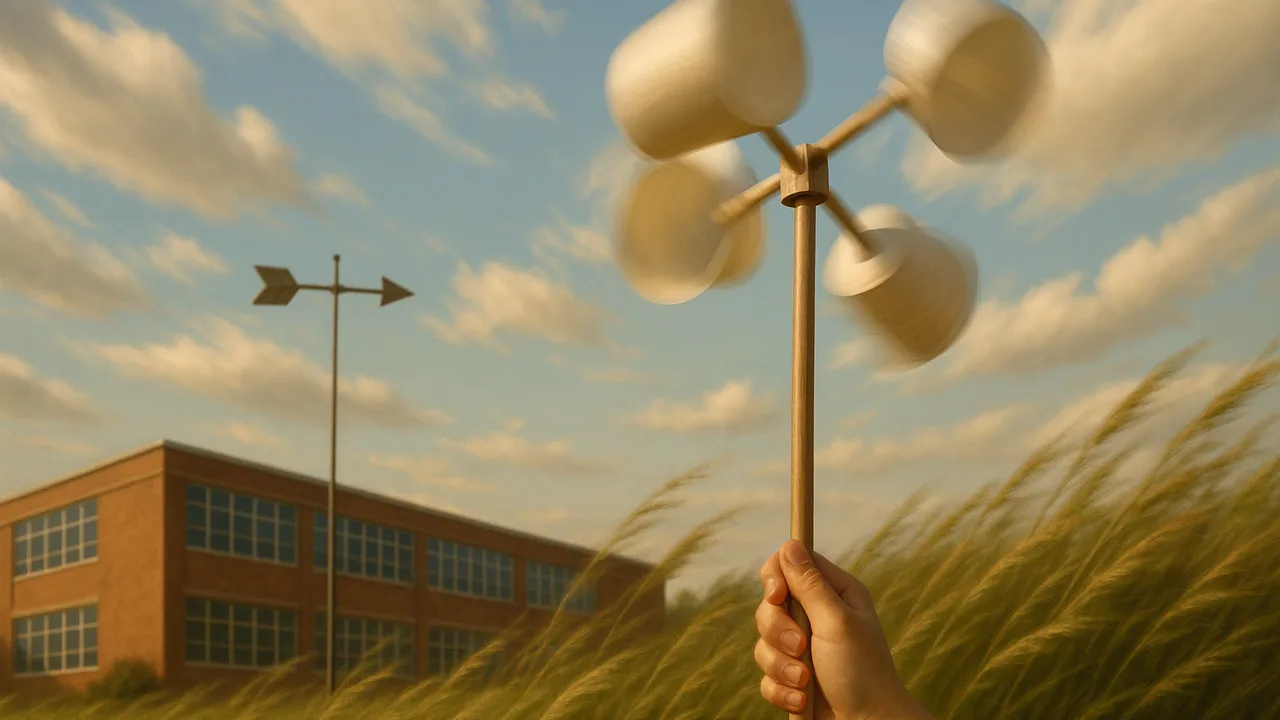
test several wind vane, anemometer and barometer designs, and use the data to compare how each design’s features meet our criteria.
- I can use data to explain similarities and differences between the features of different design solutions.
- I can make a claim about which characteristics of each design best meet the criteria and constraints, using evidence from the data.
- I can describe what data to collect to show patterns in weather conditions (like temperature, air pressure, humidity, and wind speed) over time in one area.
- I can explain how the movement and location of air masses relate to landforms, ocean temperatures, and currents.
- I can describe how large-scale weather patterns, such as storms or fronts, are related to where air masses are and how they move.
Phase 4: Build
Warm-Up ~5 min
Do Now. Look at the Part 1 weather log. On the day the cold front passed, the wind shifted and the pressure changed. Write what happened to each one.
Before the cold front arrived, what did the class barometer data most likely show?
Instruction ~10 min
Station engineers, wind and pressure tell the story of air masses. When a cold, dense air mass pushes under a warm one, the wind often shifts direction and the pressure changes. Our wind and pressure instruments help us see those changes, even though we cannot see the air itself.
Three instruments, several designs. Wind vanes use a pointer and a tail made of card, foam or plastic. Cup anemometers use three or four paper cups on straws around a pencil axle. A barometer model is a balloon stretched tight over a jar, with a straw pointer glued on top. When outside pressure rises, it pushes the balloon down and the straw tip moves up.
Worked example 1: anemometer data. Malik’s team tests three anemometers with a box fan at low, medium and high. They count spins in 30 seconds.
| Design | Low (spins) | Medium (spins) | High (spins) | Stayed balanced? |
|---|---|---|---|---|
| 3 small cups | 8 | 19 | 31 | No, wobbled |
| 4 small cups | 9 | 21 | 34 | Yes |
| 4 large cups | 4 | 12 | 25 | Yes |
(Sample class data.)
Worked example 2: comparing features. The four-small-cup design spins most at every setting and stays balanced. Large cups catch more air but are heavier, so they start slowly in light wind. The claim: small, light cups in an even number spread around the axle best meet the “shows a relative speed” criterion. The evidence is the spin count pattern across all three fan settings.
Guided Exercises ~15 min
Rotate through three stations. Record every design you test.
| Station | Design | Test result | Strength | Weakness |
|---|---|---|---|---|
| Wind vane | 1 | |||
| Wind vane | 2 | |||
| Anemometer | 1 | |||
| Anemometer | 2 | |||
| Anemometer | 3 | |||
| Barometer model | 1 |
Independent Practice ~10 min
Plan the data your station will collect.
List four weather conditions your station will record each day, with a unit or scale for each. Explain how this data could show an air mass moving in.
Your barometer model gives readings, but they are not in real units. Explain why it can still help you notice a weather change.
Closure ~5 min
You now have test data for every instrument. Next class you combine the best features into one optimized design.
Exit ticket: name one design feature that helped and one that hurt. Support each with a number or observation from today.
Teacher notes
Materials: small and large paper cups, straws, pencils with erasers, push pins, card stock, foam trays, small jars, balloons, rubber bands, a box fan with three settings, timers, a compass (teacher).
Setup: Pre-build one of each instrument as a model. Set up three stations and rotate teams every 10 minutes. Start the barometer jars today so they can be read for days.
Listen for: “a west wind blows toward the west”; “high pressure means storms.” Also note the boundary: fronts and air masses stay qualitative here.
Support / stretch: Give a sentence frame: “Design ___ worked better because its ___ caused ___.” Stretch: plot spins against fan setting for all three designs on one line graph.