4.12 Boom and Bust: Reading the Population Graph
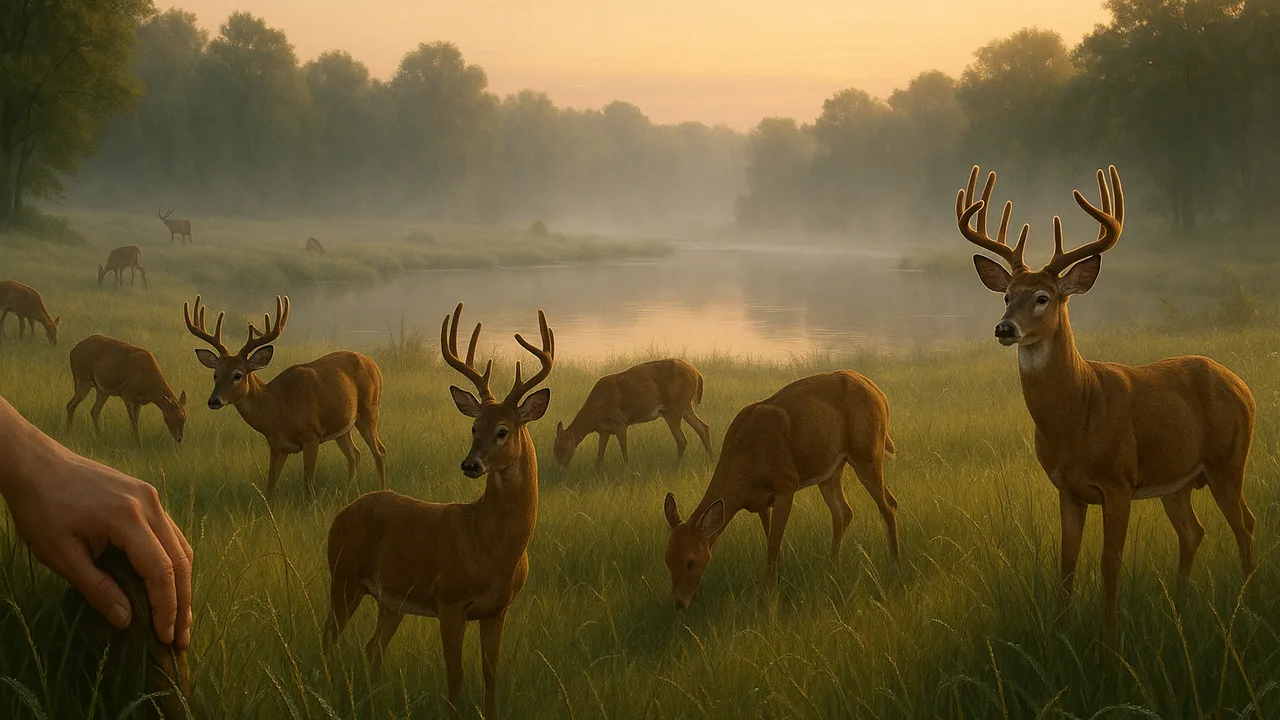
analyze a population graph to decide whether resource availability causes changes in population size, and use the evidence to predict future changes.
- I can determine if the data shows a cause-and-effect relationship between resource availability, population size, and the growth or survival of individual organisms.
- I can use evidence from data to predict how changes in resource availability might affect the size of a population.
- I can use evidence from data to predict how changes in resource availability might affect the growth of individual organisms.
- I can use evidence from data to predict how resource availability can lead to competition among organisms and affect a population’s reproduction rate.
Phase 3: Make Sense
Warm-Up ~5 min
Do Now. Ice cream sales and sunburns both go up in July. Does eating ice cream cause sunburns? Talk with a partner.
Why do ice cream sales and sunburns rise together?
Instruction ~10 min
Reading: from pattern to cause. A graph can show that two things change together. Scientists then ask three questions. Does the change in the possible cause come first? Is there a mechanism, a way one could change the other? Do other data or tests show the same link? If the answers are yes, the case for cause and effect is strong.
Worked example 1: frogs and spring rain. Here is sample data a green team might collect at a wet corner pond over six springs.
| Year | Spring rainfall (cm) | Weeks the pond held water | Frog egg masses counted |
|---|---|---|---|
| 1 | 30 | 12 | 40 |
| 2 | 18 | 6 | 12 |
| 3 | 27 | 11 | 35 |
| 4 | 12 | 4 | 5 |
| 5 | 25 | 10 | 31 |
| 6 | 21 | 8 | 22 |
In wet years, the pond held water longer and the frogs laid more eggs. The mechanism makes sense: these frogs need standing water to lay eggs, and tadpoles need weeks of water to grow into frogs. So the data support a cause-and-effect claim: more spring water causes more frog reproduction. These are sample numbers.
Worked example 2: predicting with competition. If a dry spring shrinks the pond, many tadpoles crowd into less water. They compete for food and space. Our bean data showed that crowded organisms each grow less. So we can predict smaller, slower-growing tadpoles, and fewer reaching adulthood. Fewer adults then lay fewer eggs the next year. Scarce resources lower survival and the reproduction rate.
Guided Exercises ~15 min
Use the frog table, your deer graph and the bean data.
Independent Practice ~10 min
Write a CER. Use these sentence starters:
- Claim: The amount of ___ affects the size of the ___ population.
- Evidence: In the data, when ___, the population ___.
- Reasoning: This is cause and effect because ___.
Make a scatter plot or line graph of the frog data. Then write a CER about whether spring water causes changes in frog reproduction.
Predict what would happen to the frog population over the next three years if the green team added a small, lined pond that holds water all spring. Use evidence.
Closure ~5 min
We moved from a pattern to a cause, and we used it to predict. Next time we test whether the interaction patterns we saw in our schoolyard happen everywhere.
Exit ticket: what is the difference between correlation and cause and effect? Use the frog data in your answer.
Teacher notes
Materials: graph paper, the frog table, class deer graphs from 4.07, bean data, CER starters.
Setup: project the frog table and model plotting rainfall on the x-axis and egg masses on the y-axis.
Listen for: “rain makes frogs” (rain affects the breeding habitat). Students may treat any correlation as proof; return to the ice cream example. The frog numbers are illustrative, not real survey data.
Support / stretch: pre-plot three points. Stretch: name a possible third factor, such as a cold spring, and how to test it.