4.07 Oh Deer! Resources and Population Size
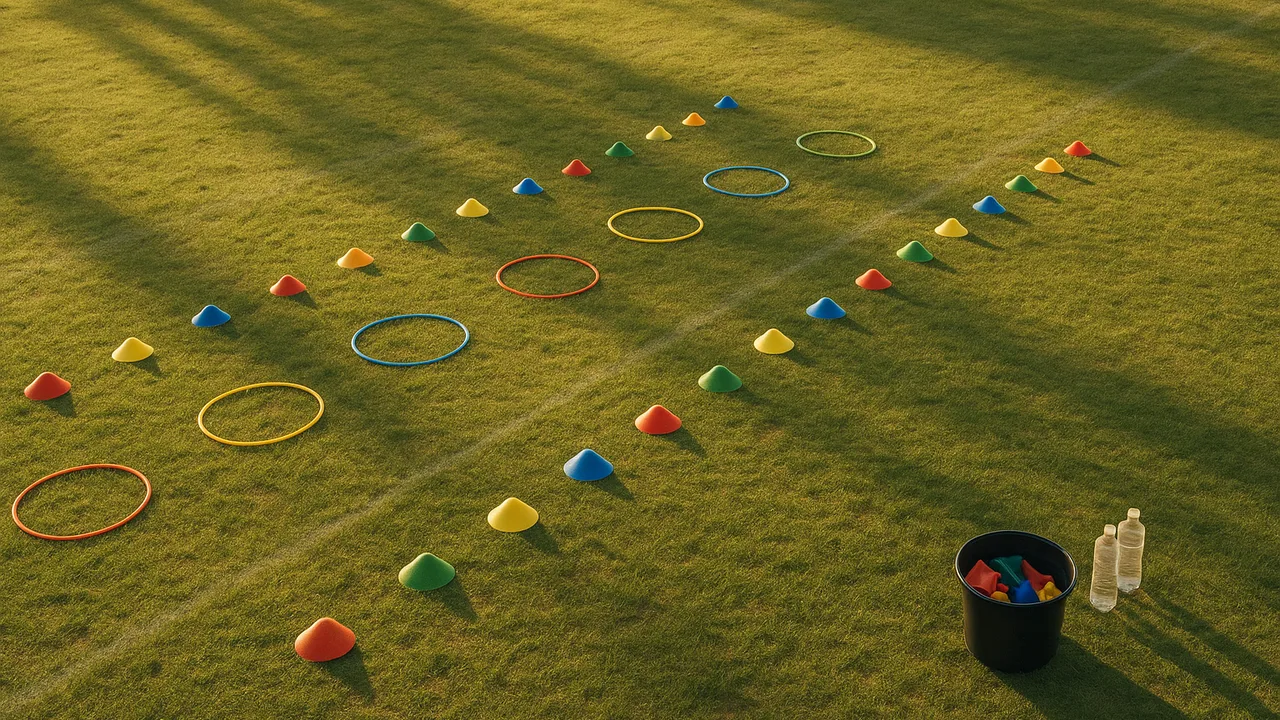
collect and organize population data from a resource game, graph it, and analyze how the amount of food, water and shelter affects population size and individual growth.
- I can organize data about how many organisms are in a population and how fast they grow or reproduce, using tables, graphs, or charts, to show how these things change with resource availability.
- I can organize data about how individual organisms grow when resources are abundant or scarce, using tables, graphs, or charts.
- I can analyze organized data to figure out how the size of a population and the growth or survival of individual organisms are affected by the amount of resources available.
Phase 2: Investigate
Warm-Up ~5 min
Do Now. A herd of deer lives in a valley with plenty of food, water and shelter. Year after year, more fawns are born. Could the herd keep growing forever? Write yes or no and one reason.
Over many years, what will most likely happen to the size of the deer herd?
Instruction ~10 min
Explore first: the Oh Deer! game. This game comes from Project WILD, a wildlife education program. The class splits into two groups along two lines. One quarter of the class starts as deer. The rest start as the habitat. Each round, every player secretly picks a sign: hands on stomach for food, hands over mouth for water, hands over head for shelter. Deer must find a habitat player showing the need they chose. A deer that finds its need survives and brings that habitat player back as a new deer. A deer that finds nothing becomes part of the habitat. Habitat players that are not chosen stay habitat.
The Recorder writes the number of deer at the start of each round. Play 12 rounds. In round 7, your teacher announces a drought: half the habitat players must show only food or shelter, not water.
| Round (year) | Number of deer | Number of habitat players | Event |
|---|---|---|---|
| 1 | |||
| 2 | |||
| 3 | |||
| 4 | |||
| 5 | |||
| 6 | |||
| 7 | Drought | ||
| 8 | |||
| 9 | |||
| 10 | |||
| 11 | |||
| 12 |
Worked example 1: organizing the data. Diego’s class started with 6 deer. Their counts were 6, 10, 15, 9, 13, 16, 12, 5, 8, 11, 14 and 10. They made a line graph with round on the x-axis and number of deer on the y-axis. The line went up when resources were plentiful, fell when deer outnumbered resources, and dropped sharply after the drought. These are sample numbers from one game.
Now we name it. A resource is anything an organism needs to survive. When resources are abundant, more individuals survive and reproduce, and the population grows. When resources are scarce, fewer survive, and the population shrinks. A resource in short supply is called a limiting factor.
Worked example 2: individual growth. Resources also affect each individual. Here is sample data from a class that planted bean seeds in two pots.
| Pot | Seeds planted | Average height after 3 weeks (cm) | Leaves per plant |
|---|---|---|---|
| A, roomy | 3 | 18 | 8 |
| B, crowded | 15 | 11 | 4 |
Each plant in the crowded pot had less light, water and soil space. The plants survived, but each one grew less. So scarce resources can limit both the size of a population and the growth of each organism in it.
Guided Exercises ~15 min
Use your class graph and the sample data.
Independent Practice ~10 min
Organize and analyze your own class data.
Make a line graph of your class's deer data. Mark the drought round. Then write two sentences describing how the deer population changed and why.
Use the bean data to explain how scarce resources affected the growth of individual plants.
Closure ~5 min
Resources control how many organisms an area can support and how well each one grows. Next time we look at how organisms interact when they share or seek resources.
Exit ticket: name one limiting factor from our game and describe what happened to the deer population when it became scarce.
Teacher notes
Materials: a gym or field, two lines of tape or cones about 10 meters apart, a clipboard, graph paper. Bean seedling pots are optional; use the sample table if you did not plant them ahead.
Setup: deer face away from habitat while choosing a sign. On “Go,” both groups turn and deer walk to a matching habitat player. Search for “Oh Deer Project WILD” for the full official rules.
Listen for: “the deer died because the game was unfair”; reframe as resources running short. Also “more food always means more deer forever.” Point to the rounds where deer outnumbered habitat.
Support / stretch: give a pre-scaled graph. Stretch: rerun two rounds with a predator added and predict the effect before playing.