4.11 Earth’s Heat Engine: Modeling Climate
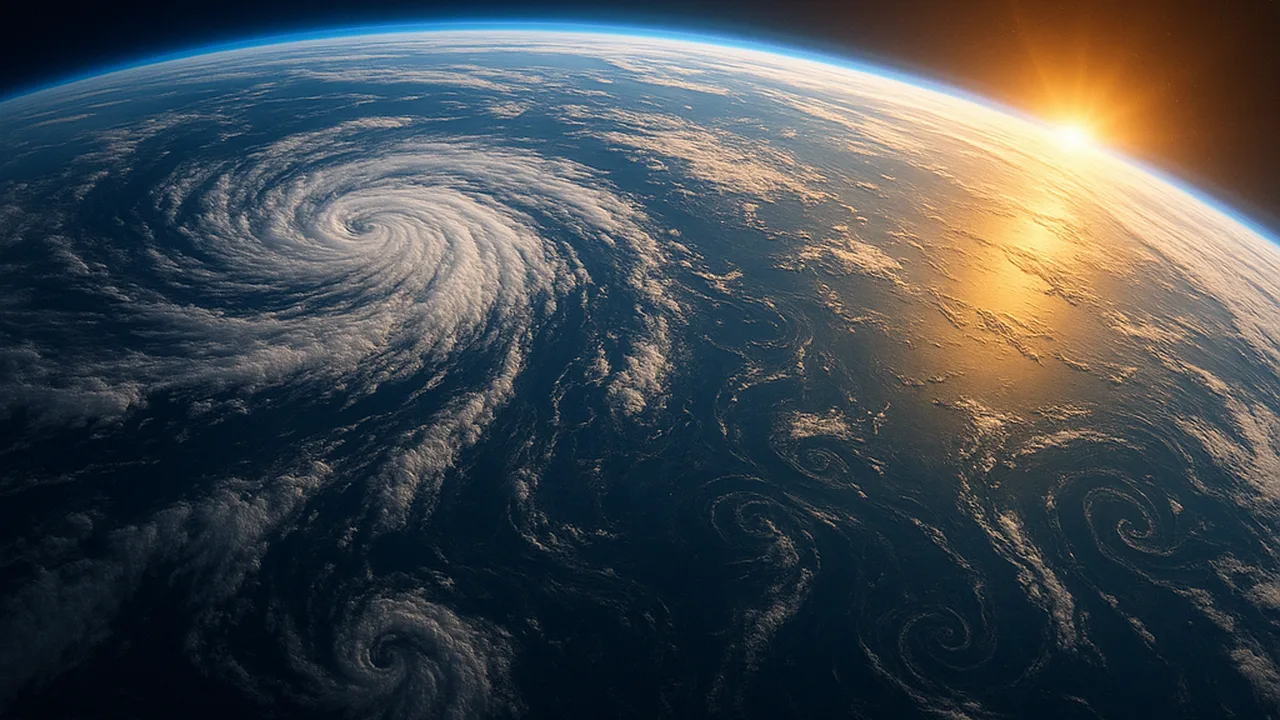
use a model of sunlight, atmosphere and ocean circulation to explain why climates differ by latitude, by distance from the ocean and by region.
- I can use my model to explain why climates near the equator are warmer and climates near the poles are colder, based on how sunlight hits Earth.
- I can use my model to describe how rising moist air and sinking dry air create patterns of wetter and drier climates at different latitudes.
- I can compare continental and marine climates using my model, showing how land and water absorb and release heat differently, leading to bigger temperature changes in the center of continents and smaller changes near oceans.
- I can use my model to explain how each part—like the ocean, atmosphere, landforms, and energy from the sun—helps create a specific regional climate.
Phase 3: Make Sense
Warm-Up ~5 min
Do Now. Shine a flashlight straight down onto graph paper. Count the squares it lights. Now tilt it to a low angle and count again. Which squares get more light each?
When the flashlight is tilted, how does the light on each square change?
Instruction ~10 min
Reading: Earth’s heat engine. The equator receives more concentrated sunlight than the poles, so it is warmer all year. Warm, moist air near the equator rises. As it rises it cools, and its water vapor forms clouds and heavy rain. That is why many tropical rainforests lie near the equator. The air, now dry, spreads toward the poles and sinks at about 30 degrees north and south. Sinking dry air brings few clouds, so many of the world’s large deserts lie near those latitudes. Ocean currents also carry warm water poleward and cold water back toward the equator.
Worked example 1: two cities, one latitude. Picture two cities at the same latitude. One sits on an ocean coast. The other sits in the middle of a large continent. Our sand-and-water data predict the difference. The ocean heats and cools slowly, so the coastal city has mild summers and mild winters. That is a marine climate. The inland city has hot summers and very cold winters, a continental climate.
Worked example 2: a mountain’s two sides. Moist ocean wind blows toward a mountain range. The air is forced to rise up the windward side, cools and drops rain or snow. By the time it sinks down the far side, it has lost much of its water. The far side is often much drier. This is called a rain shadow. One regional climate depends on the Sun, the ocean, the wind and the landforms all at once.
Using a model. A climate model is a system model. Inputs: sunlight, strongest at the equator. Parts: atmosphere, ocean, land, mountains, ice and living things. Processes: rising and sinking air, currents, uneven heating. Outputs: thermal energy radiated to space. Any regional climate can be explained by tracing these parts.
Guided Exercises ~15 min
Use the reading and your Earth system model from 4.06.
Independent Practice ~10 min
Use your model to explain a real-feeling place.
Update your Earth system model. Add rising and sinking air at the equator and near 30 degrees, one warm and one cold ocean current, and a mountain range with a rain shadow.
Describe the climate of our own area: warm or cold, wet or dry, mild or big seasonal swings. Use at least three parts of your model, such as latitude, distance from the ocean and landforms, to explain it.
Closure ~5 min
Climate is the long-term result of Earth’s heat engine. Next time we turn back to living things and explain what our population data mean.
Exit ticket: explain why a coastal city has milder winters than an inland city at the same latitude.
Teacher notes
Materials: flashlights, graph paper, a globe, a world map showing major deserts and rainforests, students’ 4.06 models.
Setup: have the 4.05 sand-and-water graphs out to connect continental and marine climates to evidence.
Listen for: “the equator is closer to the Sun” and “deserts are always hot” (dryness, not heat, defines a desert). Keep rotation qualitative; the Coriolis effect’s dynamics are outside the boundary.
Support / stretch: give a labeled cross-section of air rising and sinking. Stretch: explain how a large lake could change snowfall downwind.