4.24 The Two-Week Station Data Test
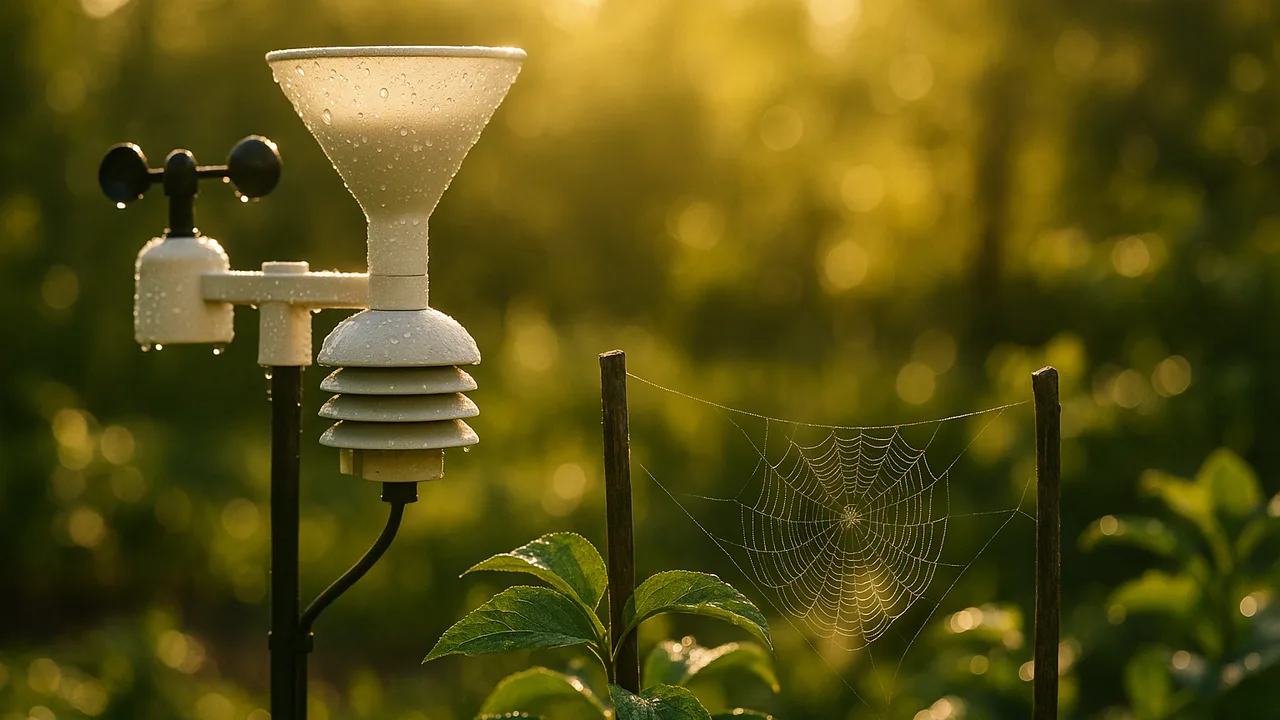
analyze two weeks of station data to judge whether our instruments and habitat plan meet the criteria, and decide on one final revision.
- I can analyze data using methods like comparing numbers or looking for patterns.
- I can identify how each design solution meets the criteria and fits the constraints by examining the data.
- I can describe how the data from my model, along with the criteria and constraints, can help me improve my design through testing and making changes.
- I can determine if the data shows a cause-and-effect relationship between resource availability, population size, and the growth or survival of individual organisms.
Phase 5: Prove It — test against the criteria
Warm-Up ~5 min
Do Now. Our station has run outdoors for two weeks. Before you look at the data, write the three criteria you think it is most likely to miss.
Why test the station for two weeks instead of one afternoon?
Instruction ~10 min
Station engineers, the data is in. Today you judge the station the way the green team will: against each criterion, with numbers.
Worked example 1: instruments vs. a professional report. Ava compares the station’s rain gauge with the nearest official weather report.
| Storm | Our gauge (mm) | Official report (mm) | Difference (mm) | Within 2 mm? |
|---|---|---|---|---|
| Day 3 | 14 | 15 | 1 | yes |
| Day 8 | 6 | 5 | 1 | yes |
| Day 12 | 22 | 27 | 5 | no |
(Sample data.) The gauge missed on the biggest storm. Ava checks the notes: the funnel overflowed. Her fix is a taller jar. Note that an official station a few kilometers away can get different rain, which is a limitation of the comparison.
Worked example 2: the habitat side. Malik’s team compares wildlife counts from the week before the habitat features went in and the two weeks after. Species seen rose from 4 to 7, and visits to the water dish were highest on hot, dry days. A pattern links the habitat change and the weather log to the populations.
Guided Exercises ~15 min
Fill in your team’s criteria scorecard from the station log.
| Criterion | Data used | Met? (yes / partly / no) | Revision idea |
|---|---|---|---|
| Rain gauge within 2 mm | |||
| Wind tools show direction and relative speed | |||
| Pressure model shows rising or falling | |||
| Survived two weeks outdoors | |||
| Habitat helps 3+ species |
Independent Practice ~10 min
Make the final revision decision.
Choose the ONE revision that would most improve the station. Explain how the data, the criteria and the constraints support your choice, and name one limitation of the test.
Closure ~5 min
The data shows what works and what to fix. Next class is Station Launch Day with the green team.
Exit ticket: which criterion did the station meet best? Which did it miss? Cite one number for each.
Teacher notes
Materials: the class station log (two weeks), the nearest official weather reports for the same dates, wildlife count sheets, scorecards, graph paper.
Setup: Start the outdoor data run right after 4.23 so two weeks of data are ready; flex time or homework can fill daily readings. If weather was dull, supply a sample week with a front.
Listen for: claiming causation from one before-and-after change; ignoring the distance to the official station.
Support / stretch: Give a scorecard with the data rows pre-filled. Stretch: calculate the mean difference between the station and the official report for all storms.