3.13 A Deep-Time Line: Fast, Slow, Small and Huge
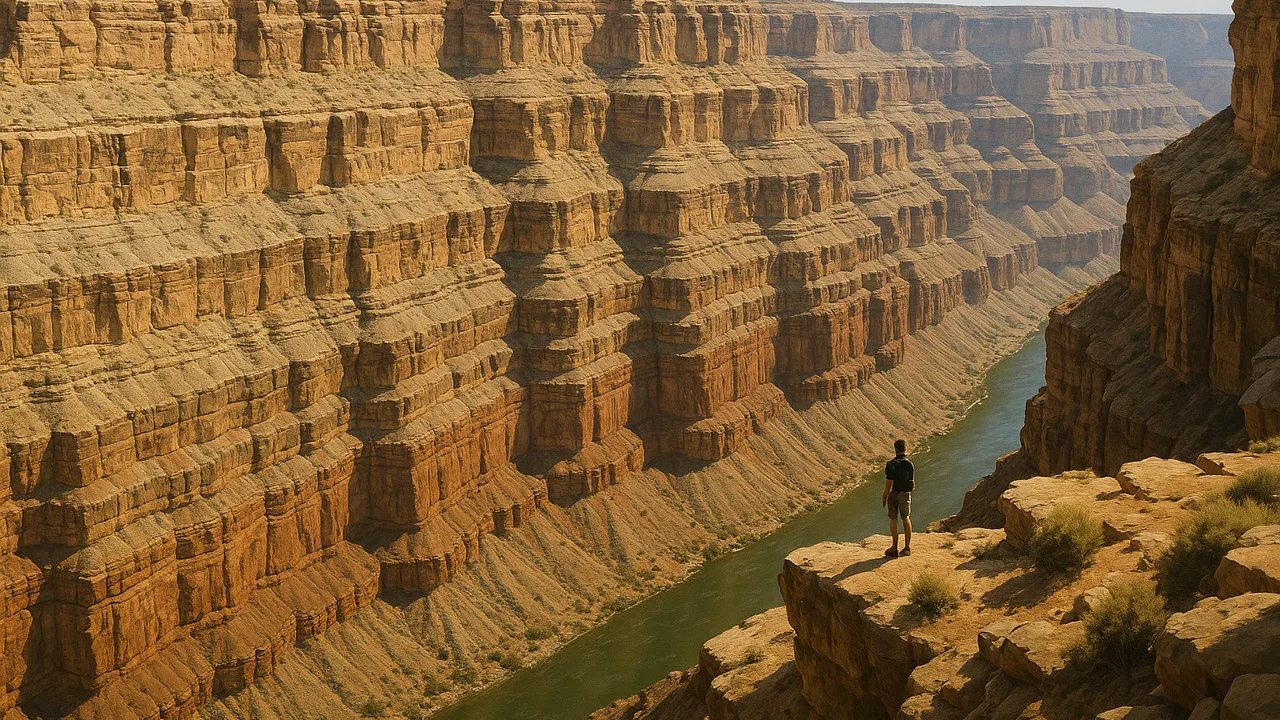
build a scaled timeline and use several sources of evidence to explain how processes at different time and size scales shaped the land.
- I can identify the timescales for different geoscience processes, such as millions of years for plate movement or seconds to days for catastrophic events.
- I can use multiple reliable sources, including my own investigations, data, and models, to gather evidence about how Earth’s surface changes at different sizes and times.
- I can use reasoning and scientific ideas to connect evidence and explain how geoscience processes have changed Earth’s surface at different times and scales.
- I can describe how plate motion creates large features like mountains and continents over millions of years, and how surface processes like erosion and deposition shape features over shorter or longer times.
- I can explain how catastrophic events quickly change Earth’s surface, and how those changes are later affected by slower processes, showing that surface features result from many processes acting over different times and sizes, and will keep changing in the future.
Phase 3: Make Sense
Warm-Up ~5 min
Do Now. Earth is about 4.6 billion years old. If you counted one number per second, it would take more than 140 years to count to 4.6 billion. Write one word that describes how that feels.
On a 4.6-meter timeline of Earth's history, how long would the time since humans appeared be?
Instruction ~10 min
Trail geologists, today we make deep time visible. Each team gets a 4.6-meter strip of adding-machine tape. Our scale: 1 cm = 10 million years. The left end is Earth’s formation; the right end is today.
Worked example 1: placing an event. The breakup of Pangaea began about 200 million years ago. Priya divides: 200 ÷ 10 = 20, so she marks it 20 cm from the right end. The extinction of the large dinosaurs, about 66 million years ago, goes about 6.6 cm from the end. The ocean-fossil rocks in mountain ridges like our park’s formed hundreds of millions of years ago, so they land tens of centimeters from the end.
Worked example 2: a fast event in the record. In 1980, the north side of Mount St. Helens, a volcano in Washington State, collapsed in a huge landslide within minutes, followed by an eruption. Diego notes that on our timeline it is far thinner than a pencil line. Yet it changed the land a lot, and since then slower processes like stream erosion and plant growth have been reshaping it. Fast and slow processes work on the same landscape.
Many sources. Scientists trust a conclusion more when several independent sources agree. Today you combine your investigation data, your models and short readings on the evidence card set.
Guided Exercises ~15 min
Place each event or process on your tape. Fill in the table first.
| Event or process | Time scale | Size scale (grain, hill, region, continent) | Source of our evidence | Tape position (cm from today) |
|---|---|---|---|---|
| Pangaea begins to break up | ~200 million years ago | |||
| Ocean-fossil rock forms | hundreds of millions of years ago | |||
| Ridges folded and lifted | ||||
| Valley carved by a creek | ||||
| A landslide after a storm |
Independent Practice ~10 min
Formative check: change at many scales.
Explain why the ridge seems unchanging to visitors, even though it is changing. Use a number from your timeline in your answer.
Give evidence of one process at a microscopic or grain scale and one at a continent scale. Name the time scale of each.
Closure ~5 min
Our deep-time line shows that today’s land is one frame in a very long movie. Next lesson, we brainstorm how the trail guide can tell that story.
How confident are you that you can I can explain how processes at different time and size scales change Earth's surface.
Exit ticket: where on our timeline would your own lifetime go? What does that tell a visitor about landforms?
Teacher notes
Materials (per team): 4.6 m of adding-machine tape, meter sticks, markers, an evidence card set you prepare from reliable sources (a USGS page on the 1980 Mount St. Helens landslide, a short reading on seafloor ages, a short reading on how rivers carve valleys), team data from 3.05–3.10.
Timing (50 min): Do Now 4, mini-lecture 8, timeline 14, guided questions 12, formative checks and exit 12.
Listen for: unit errors (million vs. billion). Keep dates rounded and labeled “about.” The CER and independent answers are formative checks of MS-ESS2-2:1a, 1b, 2a, 2b and MS-ESS2-1:3c.
Support / stretch: Pre-mark every 10 cm on the tape. Stretch: find one more fast event and one more slow process from a reliable source and add them.