4.07 Shadow Tracker, Part 2: Graph a Day of Shadows
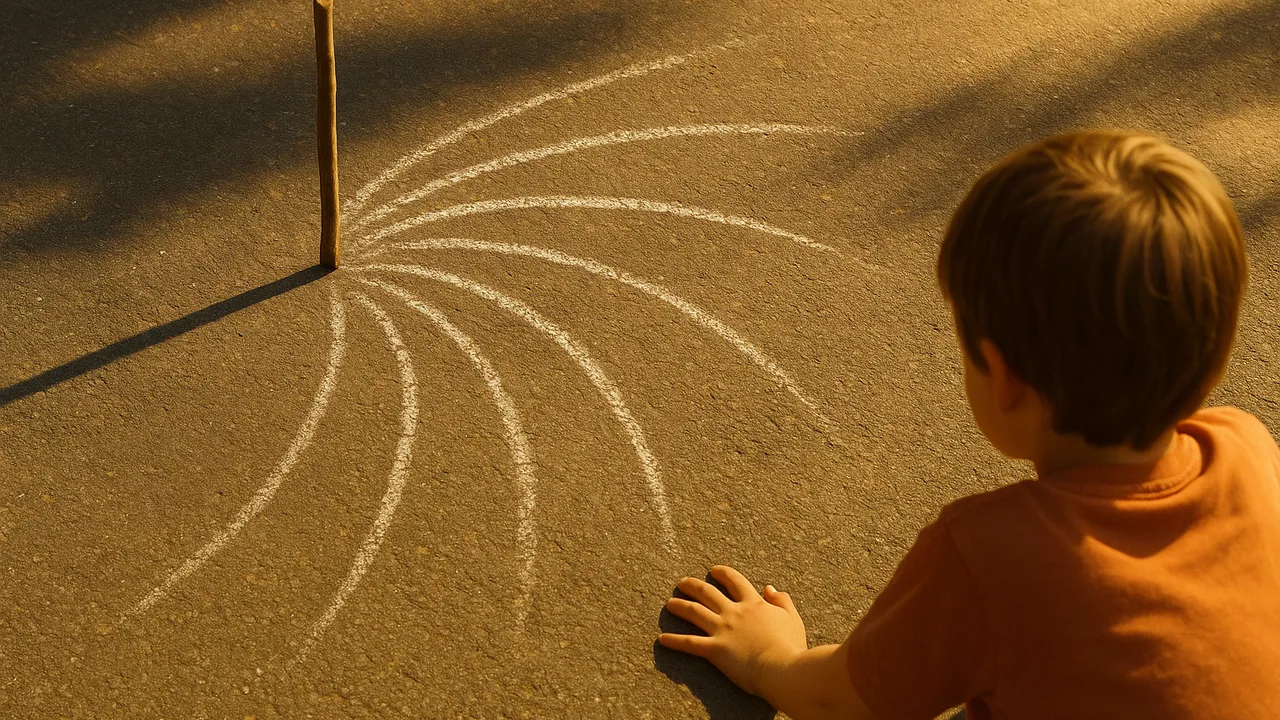
finish a full day of shadow readings, graph shadow length against time, and use the data to describe how the Sun’s position changes the shadows.
- I can organize data about how the length and direction of shadows change at different times during one day using graphs or charts.
- I can use graphs to show how the amount of daylight changes throughout the year by recording sunrise and sunset times.
- I can organize data to show which stars or groups of stars are visible in the night sky at different times of the year.
- I can use my data to explain how the sun’s movement across the sky causes shadows to change in length and direction during the day.
- I can use my data to describe how the length of the day changes throughout the year, with longer days in summer and shorter days in winter.
- I can use my data to explain that some stars or groups of stars can be seen all year, while others are only visible at certain times.
Phase 2: Investigate
Warm-Up ~5 min
Do Now. Look at the dots on your shadow paper. Each dot is one reading. Trace the path the dots make with your finger. Talk with your team about what shape you see.
If we keep reading until 3:00, what will happen to the shadow after midday?
Instruction ~10 min
Finish the day. Take afternoon readings at 1:00, 2:00 and 3:00 in the same way as the morning: dot, time, length, direction. Then bring the boards inside.
| Clock time | Shadow length (cm) | Shadow points toward | Where the Sun is |
|---|---|---|---|
| 1:00 | |||
| 2:00 | |||
| 3:00 |
Make a bar graph. Put clock time along the bottom, from 9:00 to 3:00. Put shadow length up the side, in centimeters. Draw one bar for each reading. Give the graph a title and label both sides. A graph turns a list of numbers into a picture, so a pattern jumps out.
Worked example 1: Malik’s team graph. Here are their sample lengths for a 20 cm stick on one spring day: 9:00 was 54 cm, 10:00 was 33 cm, 11:00 was 21 cm, 12:00 was 15 cm, 1:00 was 12 cm, 2:00 was 13 cm and 3:00 was 19 cm. Their bars went down, bottomed out, then went back up, like a valley. The shortest bar came around 1:00, not exactly 12:00. Keep that surprise in mind. We will explain it in 4.12.
Worked example 2: the direction fan. Malik’s team drew a line from the stick to every dot. The lines made a fan shape. Morning shadows pointed west. Midday shadows pointed north. Afternoon shadows pointed east. The shadow always pointed away from the Sun. As the Sun moved across the sky from east to west, the shadow swung from west to east.
Now we can name it. The Sun seems to move across our sky each day. It starts low in the east, climbs highest near midday, then sinks low in the west. When the Sun is low, shadows are long. When the Sun is high, shadows are short.
Guided Exercises ~15 min
Use your graph and your direction fan to answer these with your team.
Independent Practice ~10 min
Use your own graph and table.
Write two sentences that describe the daily shadow pattern. One should be about length and one about direction. Use your data.
How confident are you that you can I can organize shadow data in a table and a graph.
Closure ~5 min
A day of shadows made a valley on our graph and a fan on our paper. Next time, we use a globe and a lamp to explore day and night.
Exit ticket: a family visits the library's shadow clock at 10:00 and again at 2:00. Describe how the shadow will be different.
Teacher notes
Materials: the shadow boards from 4.06, rulers, graph paper, colored pencils, a class chart for every team’s lengths.
Setup: collect afternoon readings at set times as in 4.06. If the day turns cloudy, use the sample data and finish the readings on the next sunny day.
Listen for: “the shortest shadow should be at 12:00 exactly.” In many places in the United States during daylight saving time, the Sun is highest closer to 1:00 p.m. by the clock (look up solar noon for your own location to check). Let students notice it; we revisit it in 4.12. Shadow directions given here are approximate for our area. Keep 5-ESS1-2 to the pattern; do not explain seasons.
Support / stretch: provide a pre-labeled graph frame. Stretch: make a line graph on the same axes and discuss which graph shows the pattern better.